
Gaps And Warnings And Volatility, Oh My

NOTE: This is an excerpt from Monday's premium note.
Splat
Traders get to start the new week staring at large losses in the futures. That follows a week that was pretty much straight down, with the S&P 500 losing ground for the past 5 sessions.
We haven't faced this kind of opening pessimism since 2016. The other times it triggered, there was some buying interest on the day of the large gap (i.e. today), but most didn't hold longer-term.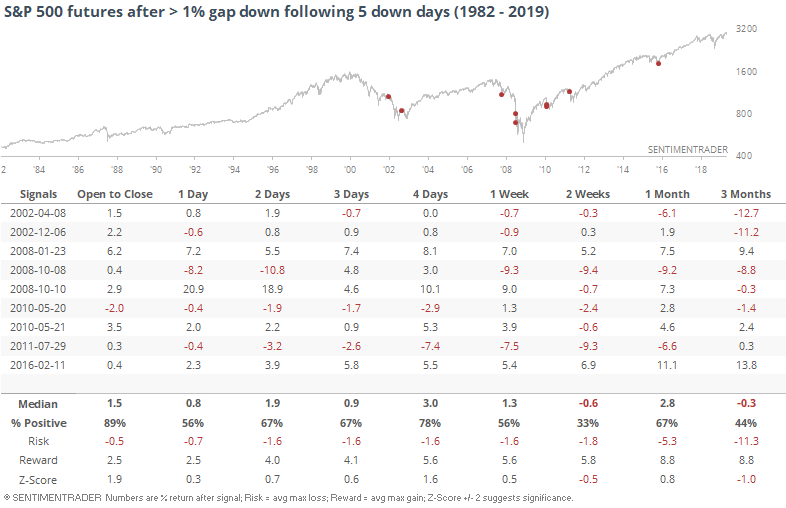
It's also Monday, and traders have a tendency to overreact to weekend news events. If we look for a large gap down on a Monday following multiple down days, it's not quite so negative. We can see from the charts above that many of these triggered during the bear markets in 2001-02 and 2007-08. If we only look at large gaps down that triggered within a week of a 52-week high, traders' behavior turned more optimistic.
Warnings
The biggest warning sign among the indicators we follow continues to be the "split" market. We looked at this various ways a couple of weeks ago, and it was ringing the alarm bells.
If we ignore the silly names and focus on what these warnings are saying, then it's telling us that while stocks were rising over the past few weeks, too many stocks were diverging strongly from the trend, on both the NYSE and Nasdaq exchanges. It has paid to heed these warnings.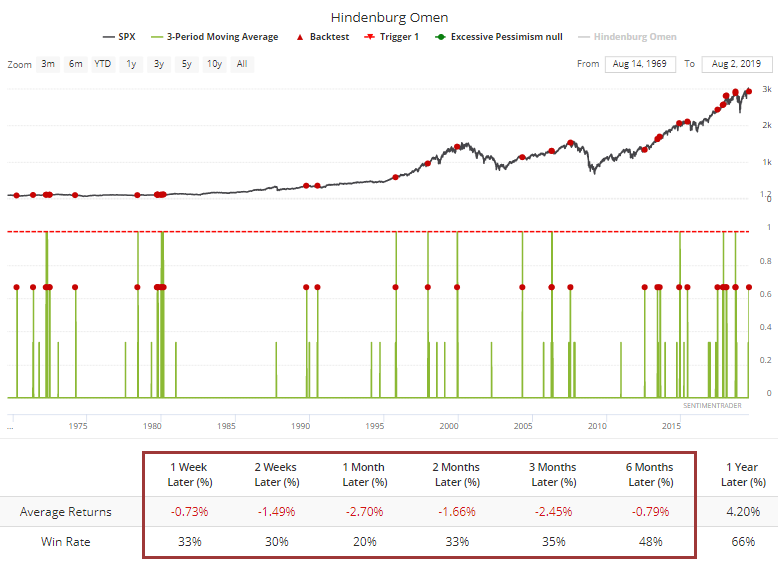
These signals have failed at times in the past, like in 2017. But longer-term, they have been helpful. If we look for little clusters, at least 2 Hindenburg Omens in the past 3 sessions, future returns in the S&P were bleak. Only 9 out of 46 signals (when the 3-day moving average crossed above 0.66) resulted in a higher index a month later. Ouch.
Volatility Explosion
The jump in concern has pushed the VIX more than 75% above its low from the past couple of weeks.
That's a lot, but it has not been an adequate signal that traders are panicking. Over the next couple of weeks, the S&P actually showed quite poor returns.
Small Traders
One of the big warning signs a couple of weeks ago was the speculative enthusiasm among the smallest of options traders. They spent more than 40% of their volume on buying call options, something that has preceded very weak returns for stocks.
They backed off a bit in the week following that initial note, but then in a troubling sign, actually increased their call buying last week.
Sector Breadth
The heavy selling on the Nasdaq that triggered these warnings, and so many new lows, can also been seen in some of the breadth metrics. More than 44% of tech stocks have sold off hard enough, and swiftly enough, to trade below their Bollinger Bands. That's one of the few indicators showing a high level of pessimism.
One market where those signals are widespread is in Hong Kong. Investors have become spooked, and nearly half the stocks have sold off enough to become oversold. That has pushed almost a fifth of them to hit 52-week lows.
The McClellan Oscillator there has sunk to one of its lowest levels in 15 years.
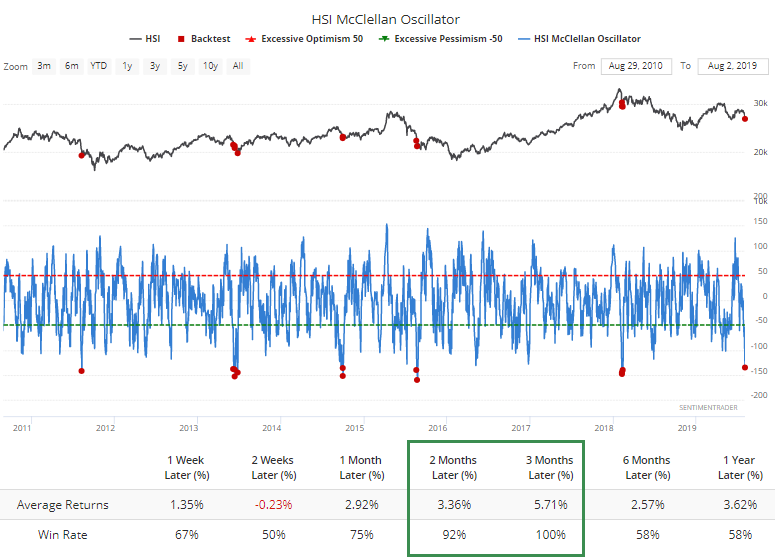
The market bounced back over the next 2-3 months the other times it got this low during the past 15 years.
This post was an abridged version of our previous day's Daily Report. For full access, sign up for a 30-day free trial now.