
Thursday Color - Islands, Emerging Streak & Breadth, Signs Of Anxiety, Gold

Here's what's piquing my interest as traders try to put Monday's carnage behind them.
Island Time
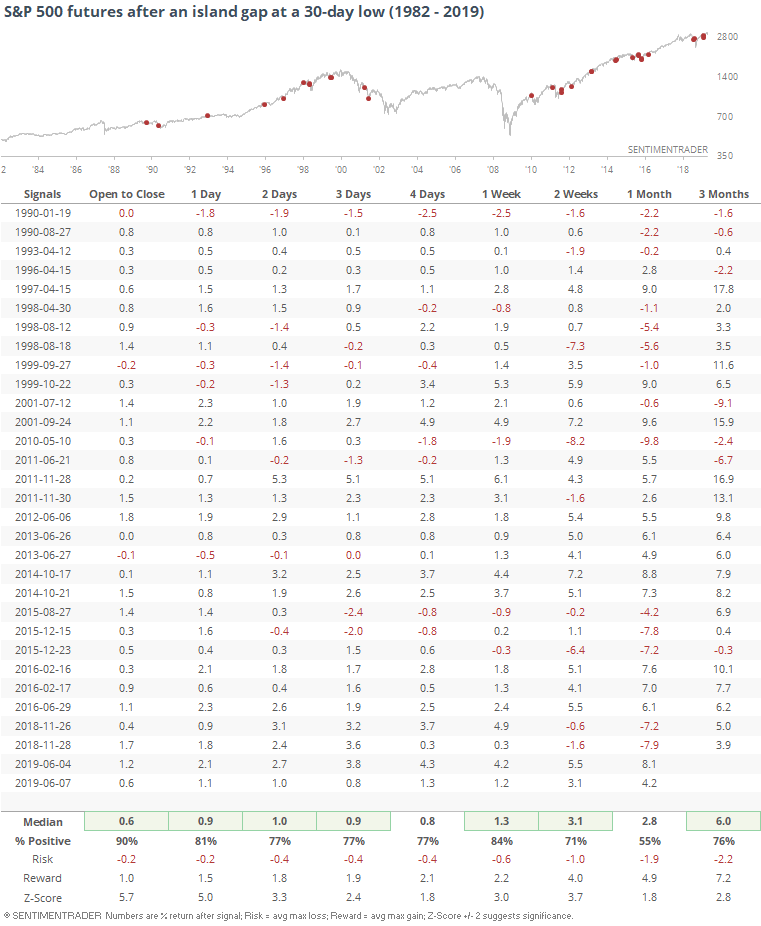
It's still early, of course, but stocks are making a valiant attempt to carve out an "island" bottom. This happens when traders panic and force an unfilled gap to the downside (Monday in our current case), chop around, then buyers step in and push an upfilled gap to the upside.
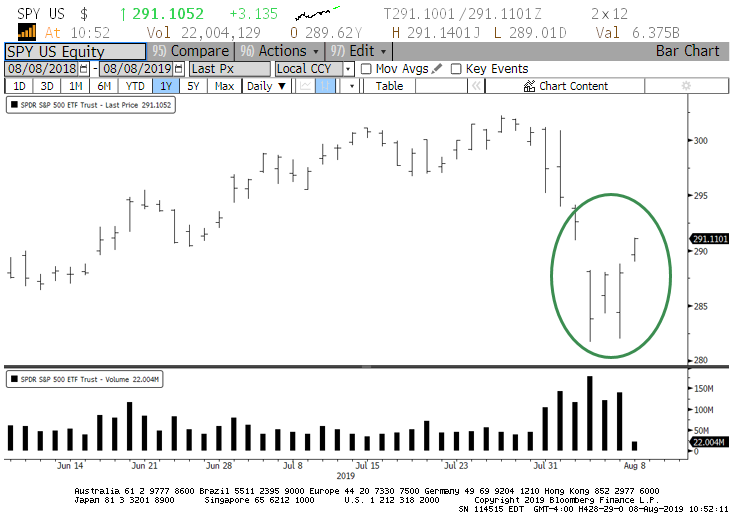
Assuming today's low holds, it has a good record at preceding further gains.
No Reprieve
We saw in yesterday's note that the slide in Asian shares has seeped into broader emerging markets, with a rise in 52-week lows. Not enough to signal panic just yet, but definite pessimism.
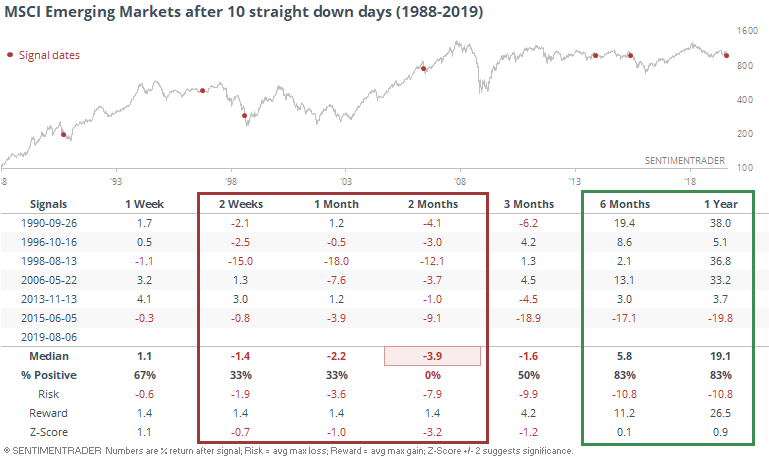
It's no wonder, considering that the MSCI Emerging Markets index has lost value for 10 straight days. That's among its longest streaks since its inception 30 years ago.

For most indexes, that's usually a sign of over-enthusiastic sellers. But in this case, the index has continued to decline over the next 2 months every time. Small sample, but this is unusually consistent.
The relief came longer-term. That was especially the case in the two instances (besides yesterday) when the selling streak culminated in a 6-month low.
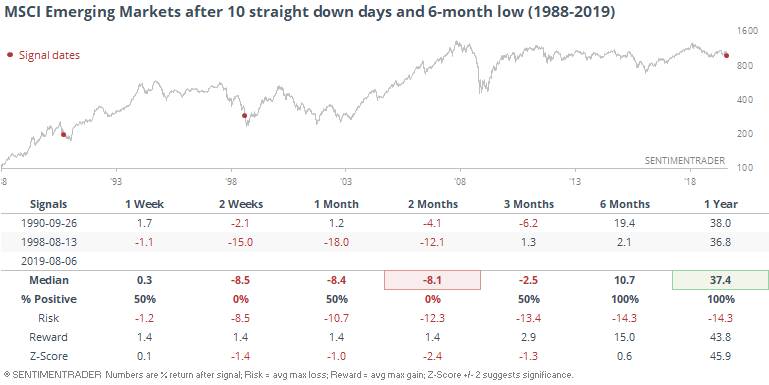
There were still hefty shorter-term losses, but both times, emerging markets were in the final phase of a meltdown, and 1-year returns were north of 36%.
Outside of the financial crisis, when nearly 20% of emerging market stocks have sunk to 52-week lows, it has led to a shorter-term bounce, not necessarily a sustained low.
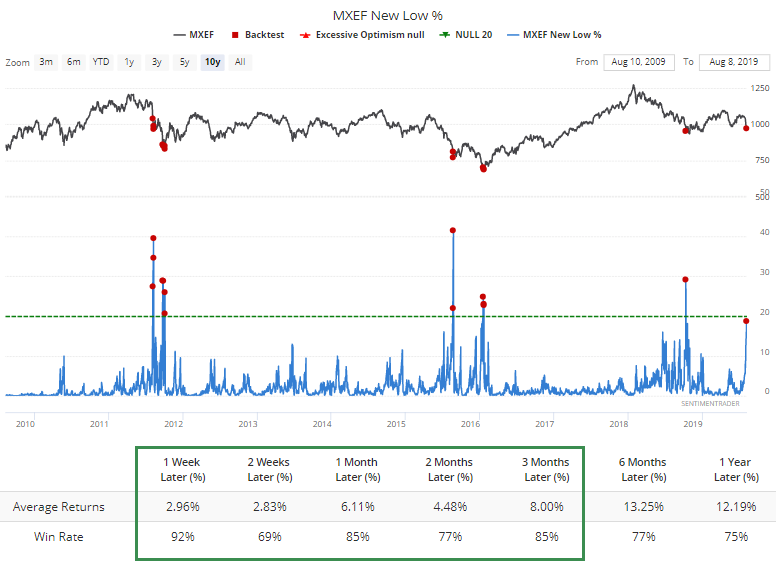
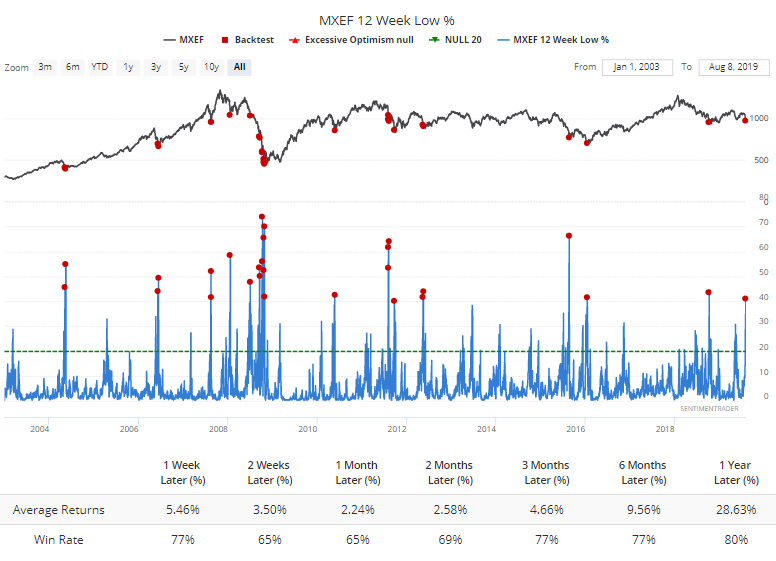
More than 40% of them have hit multi-month lows. Typically good for a bounce, even including 2008's failures.
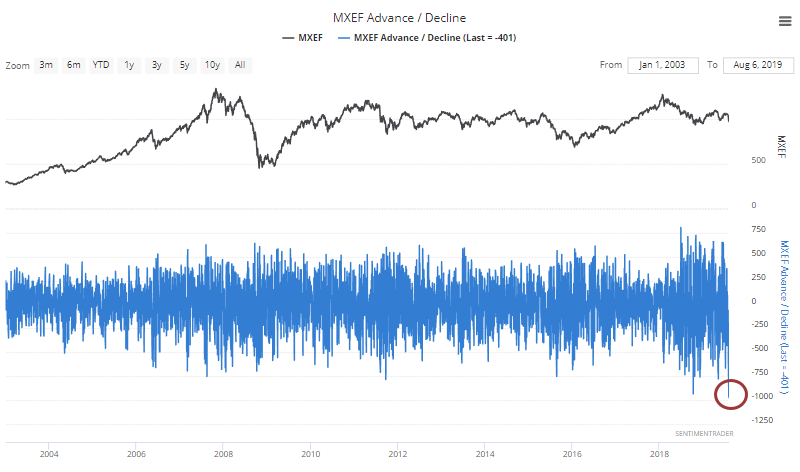
The recent selling was so widespread that the advance/decline figure hit the lowest level in 15 years.
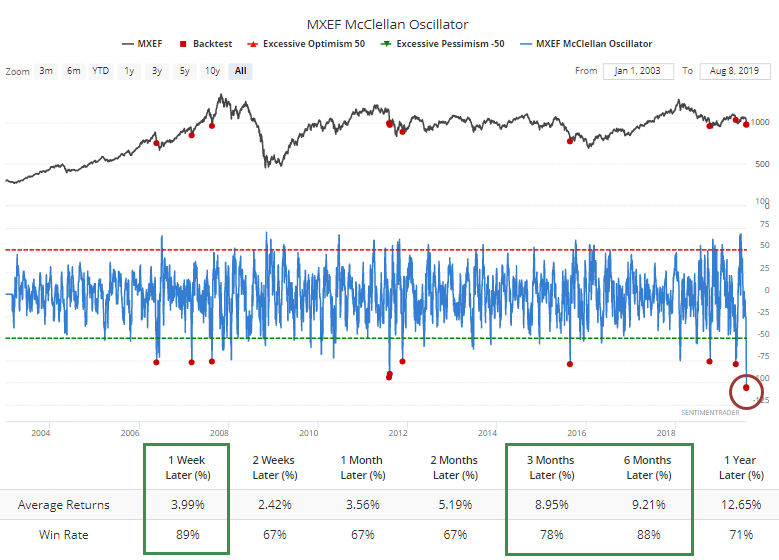
That pushed the McClellan Oscillator to a 15-year low as well. Other times it fell below -75 typically preceded a quick snapback.
Sector Breadth
Other breadth metrics are showing large-but-not-quite-truly-extreme levels of selling pressure. What's most unusual about many of them is the market environment. They're throwing off readings typically seen during downtrending markets, not ones that are holding up relatively well.
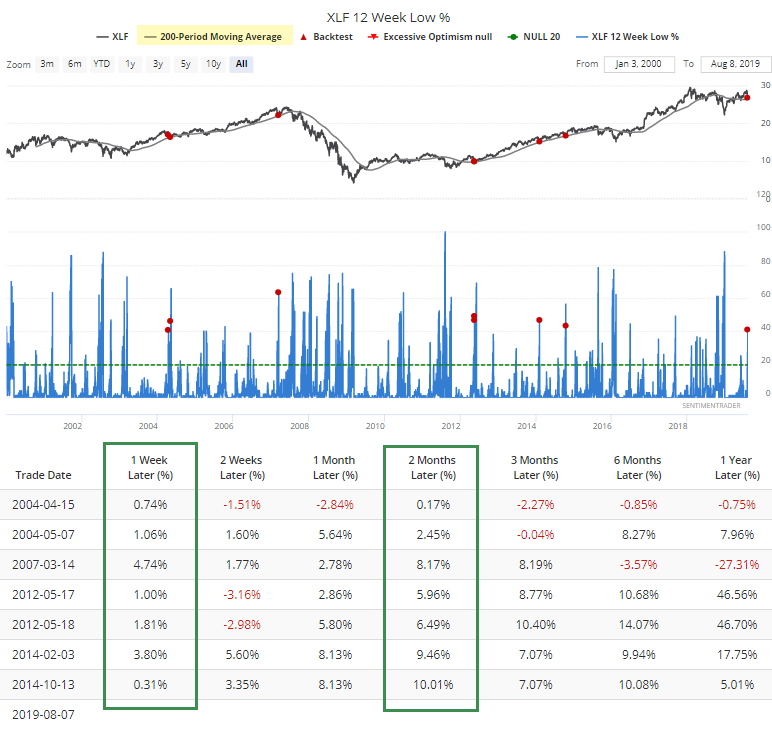
In financials, for example, more than 40% of stocks have slid to a multi-month low, even while indexes are holding above their 200-day averages. The handful of times that's happened before, the sector rallied.
Signs Of Fear (Kinda)
We saw yesterday that equity options traders have greatly favored puts versus calls for their activity in recent days, and that has spread to other products besides just equities. The Total Put/Call Ratio has averaged more than 1.2 over the past three sessions (meaning 20% more volume in puts than calls), which has been a good medium-term sign.
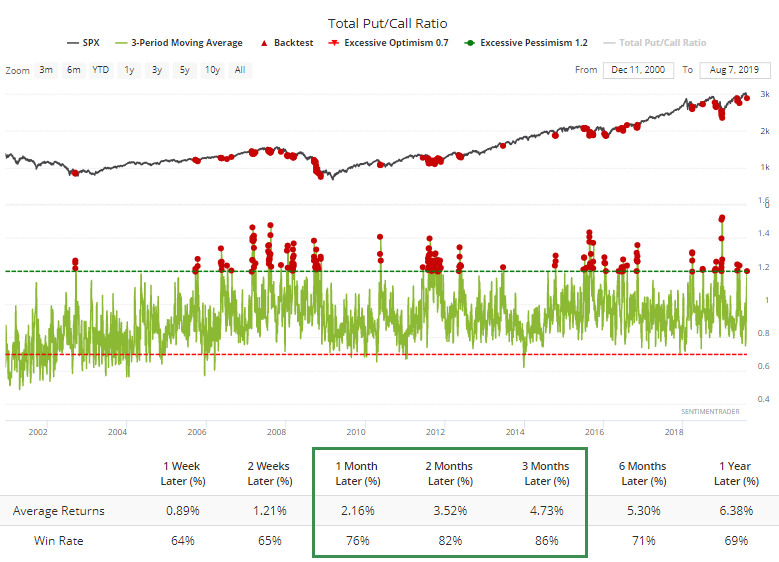
Especially when the S&P was still holding above its long-term average.
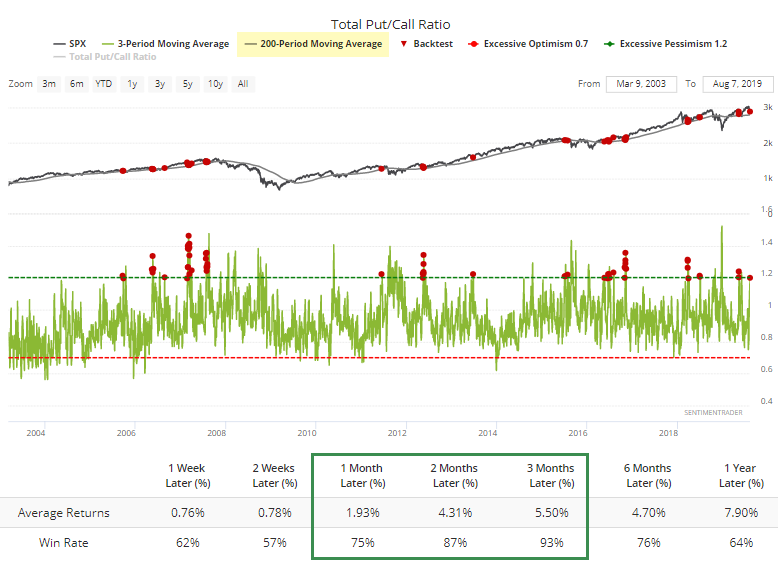
Out of 59 days that qualified, 55 of them showed a positive return 3 months later.
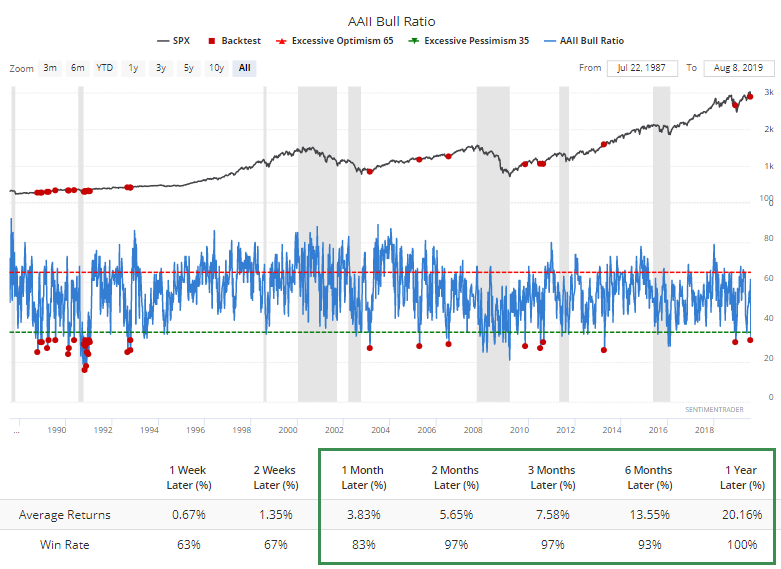
The scary drop triggered an exodus of bulls among newsletters, as we saw yesterday, and also individual investors. This week's AAII survey showed one of the largest drops on record, pulling the Bull Ratio down to a lowly 31%. It's been rare to see this kind of pessimism even during bear markets.
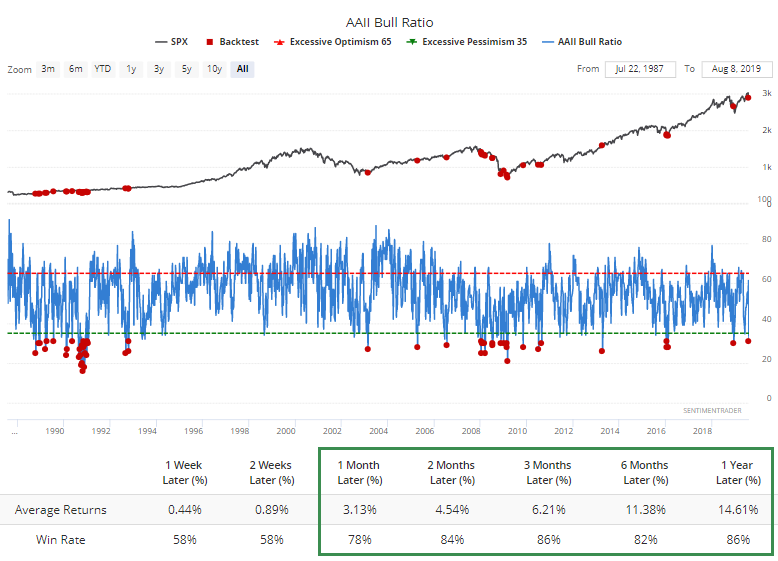
During bull markets, optimism this low has preceded some ridiculously positive returns.
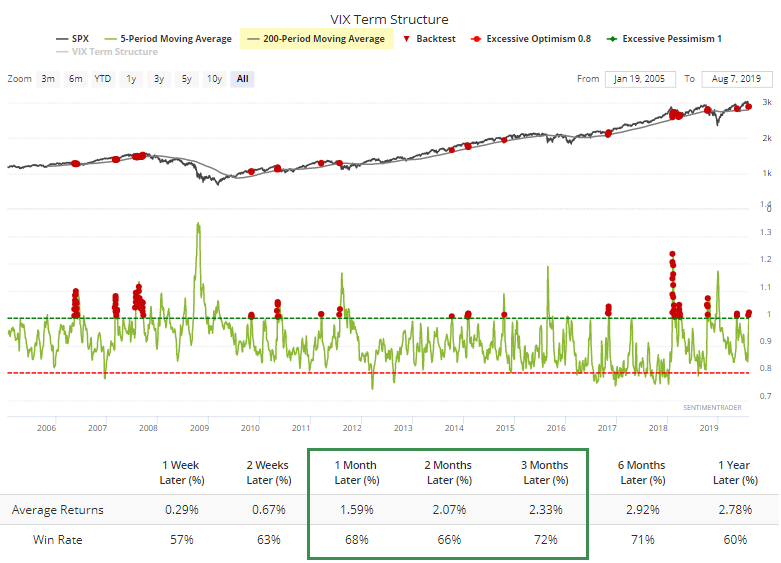
The pressure has caused traders to price near-term volatility expectations well above longer-term ones, which we usually see during times of extreme nervousness. The VIX Term Structure has averaged more than 1.0 for the past 5 days. Fairly uncommon during an uptrending market, and has led to decent - but not spectacular - medium-term returns.
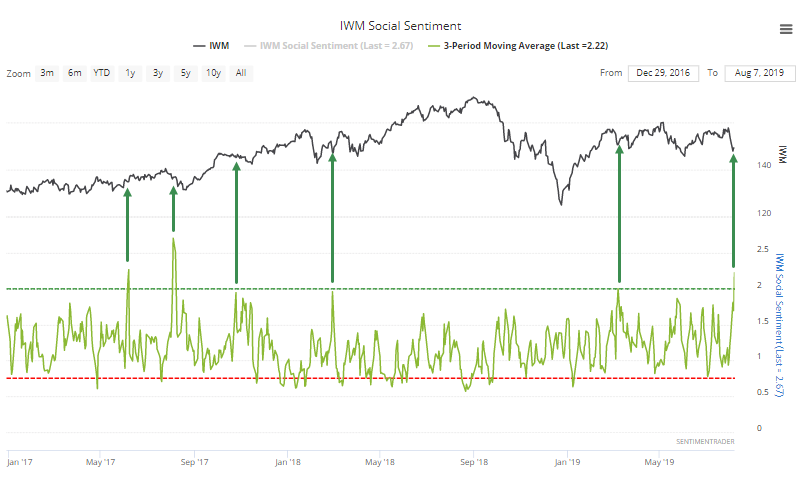
Folks on Twitter don't seem to like the market's prospects, either, especially in small-caps. Bearish messages have outnumbered bullish ones 2-to-1 over the past few sessions.
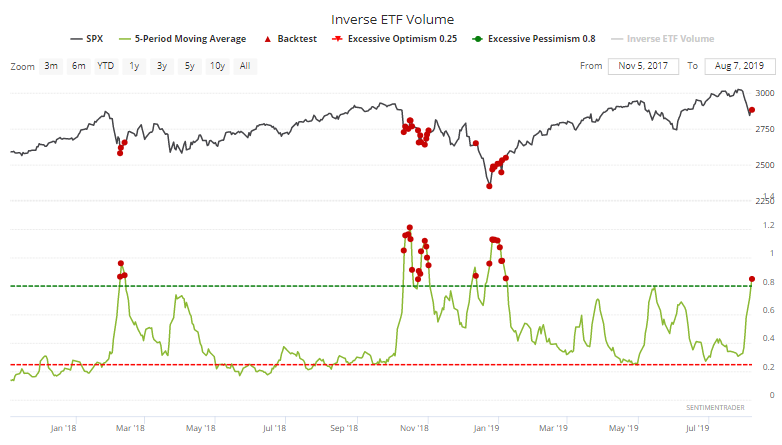
There has also been a distinct increase in volume in inverse ETFs, accounting for more than 0.8% of NYSE volume over the past week.
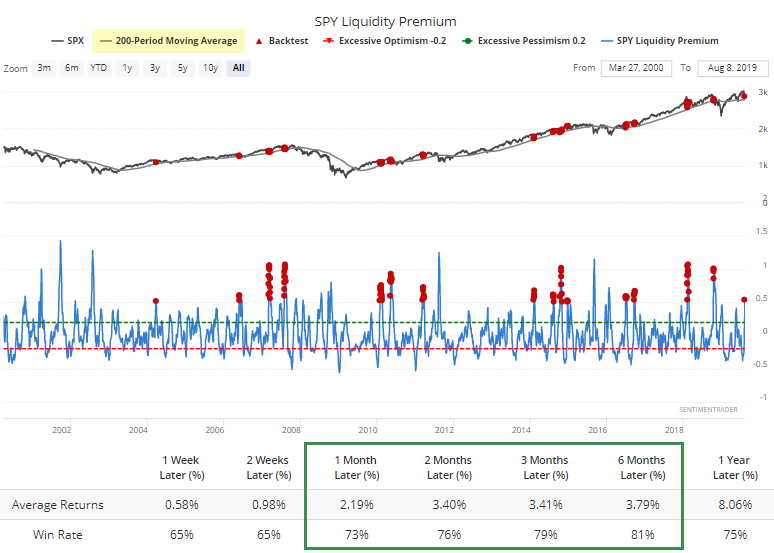
Traders have preferred ETFs generally, especially the most liquid ones, versus individual stocks. We see this "liquidity premium" most often when traders are extremely anxious.
Climbing On Board
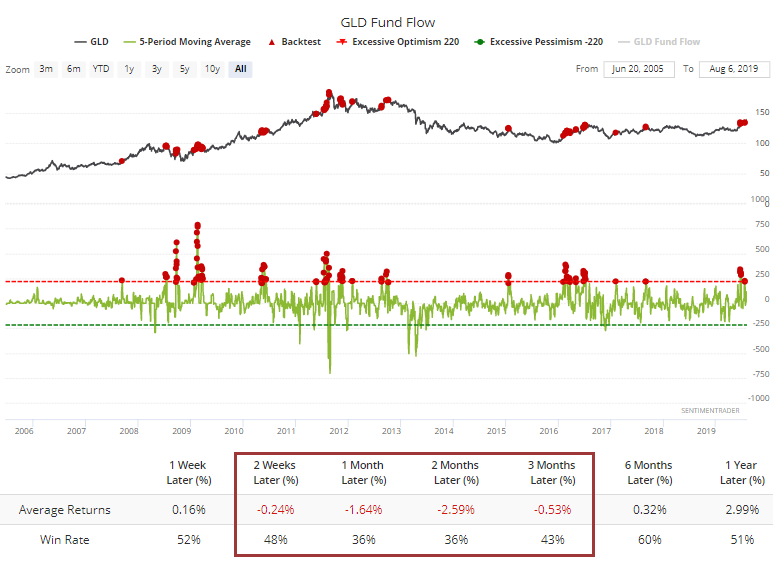
More and more ETF traders have been moving into gold to take advantage of its perceived haven. An average of more than $200 million per day has flowed into GLD over the past week. Gold bugs gotta hope that this is different than most other times over its history.
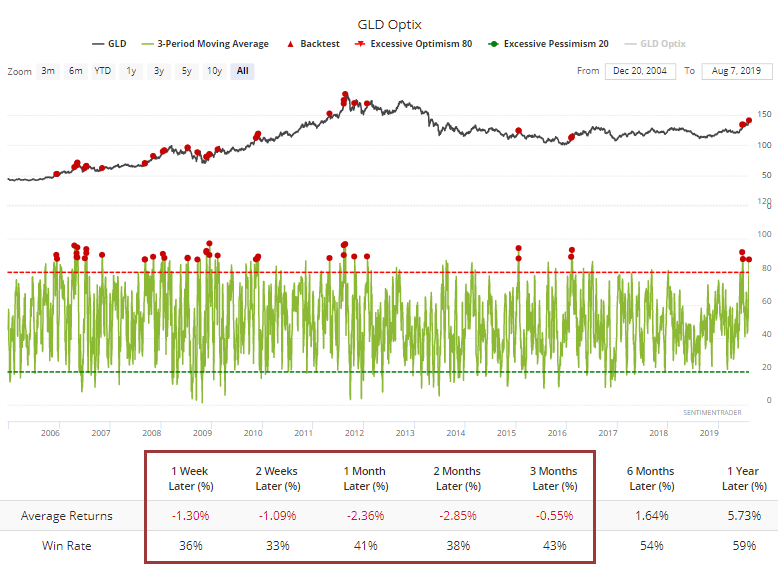
The Optimism Index on GLD has soared to an average of nearly 90% over the past 3 sessions. It's been hard for the metal to sustain this kind of intense interest for long.
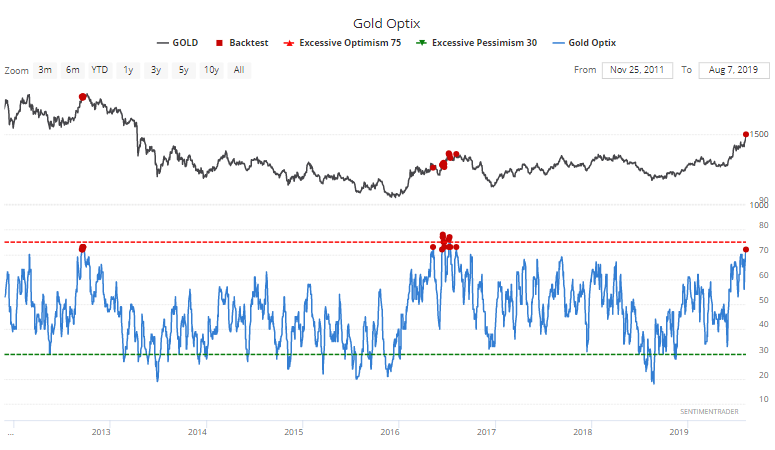
The longer-term Optimism Index on gold itself has climbed to one of the highest readings since the market peaked in 2012.
As always, if the market can continue higher virtually unabated after readings like this, it strongly suggests something fundamental has changed. We've already seen some signs of that over the past couple of months.