
5 Weeks Of Losses - What's Next?

Dow dinged
The Dow Industrials have lost ground for five straight weeks, its 2nd-worst stretch since the financial crisis and among its worst since 1900.
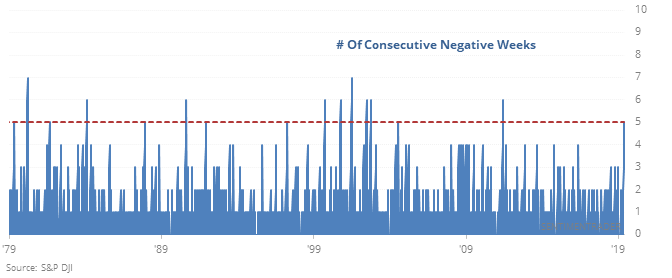
It’s relatively unusual to see such a string of losses while relatively close to a 52-week high, and over the past 40 years that has led to excellent returns. Before that, not so much.
Hiding in safety
Low volatility stocks within the S&P 500 hit another new high this week, while the high beta ones fell to a 50-day low.
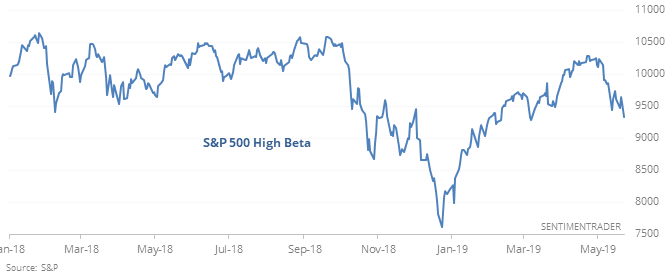
They have not been good leading indicators, as stocks rallied under similar conditions. Low volatility stocks did best relative to their typical returns. For the full S&P 500 index, it tended to coincide with temporary bouts of extreme risk-off sentiment within the index, and over the next month it rebounded all 6 times.
Big and immovable
Two areas lagging badly have been small-cap stocks and ones that move things. But the Russell 2000 and Dow Transports are more than 10% from their highs, while the S&P 500 has held up much better. That has led to further weakness in those indexes versus the market in general.
As a sign for the market in general, it’s not great, but not doomsday, either. This kind of behavior occurred near the peaks in 1990, 2000, and 2007, which is concerning. But it also triggered in 1986, 1996, 1998, and 2006, all preceding gains of more than 20% in the S&P 500 within a year.
The latest Commitments of Traders report was released, covering positions through Tuesday
The 3-Year Min/Max Screen shows that “smart money” hedgers continued to build exposure in cotton to a level that has resulted in rallies more than 70% of the time. They’ve aggressively covered shorts in silver, now holding less than 5% of open interest net short. Silver has rallied 83% of the time over the next 3 months when hedgers held this few contracts short according to the Backtest Engine.
This post was an abridged version of our previous day's Daily Report. For full access, sign up for a 30-day free trial now.