
9 Months Without a Pullback in One of the Most Consistent Years Ever

This year has behaved like few in market history.
Last month, we showed that through the first half of the year, 2021 has been one of the most consistent and persistent rallies ever. It's done nothing but continue.
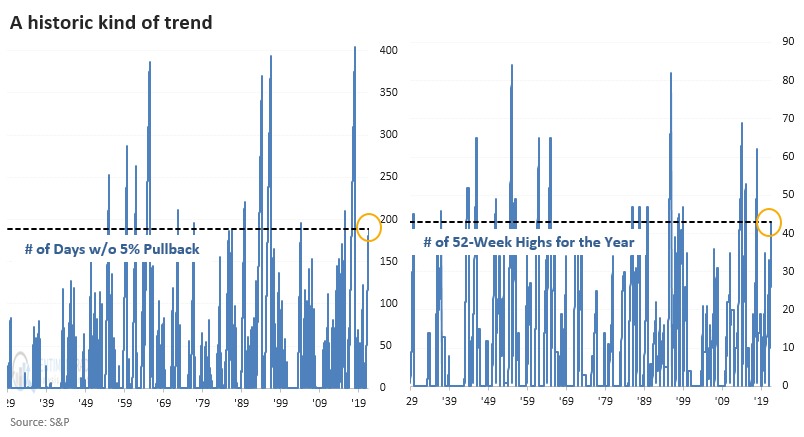
Through late last week, the S&P 500 had gone 189 days - nine consecutive months - without being more than 5% from a 52-week high. And it recorded its 43rd day with a 52-week closing high.
MOMENTUM = TOO MUCH SHORT-TERM, JUST RIGHT MEDIUM-TERM
Looking at them separately, after other times the S&P managed to go 189 sessions without being more than 5% from its high, it suffered some poor short-term returns. We've seen this kind of result with many other momentum studies so far this year, and yet here we are sitting at an all-time high, so there's that.
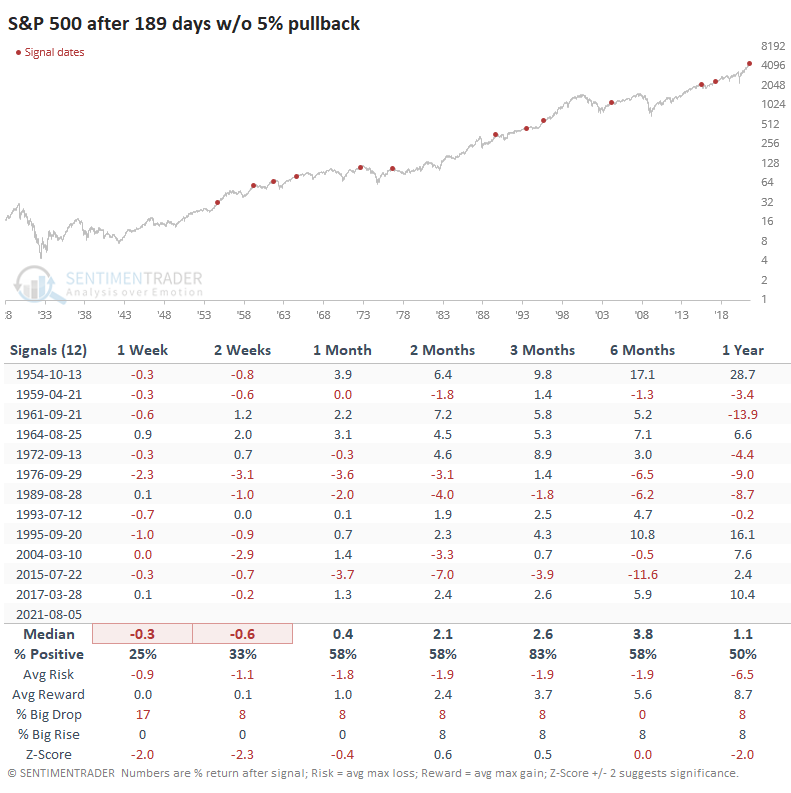
Longer-term returns were nothing special. Everything was about in line with random. The only outstanding feature of the forward returns was just how tepid they were, without many big movements either way. Pretty much the definition of digestion. The best performance was over the next three months, with only two minor losses.
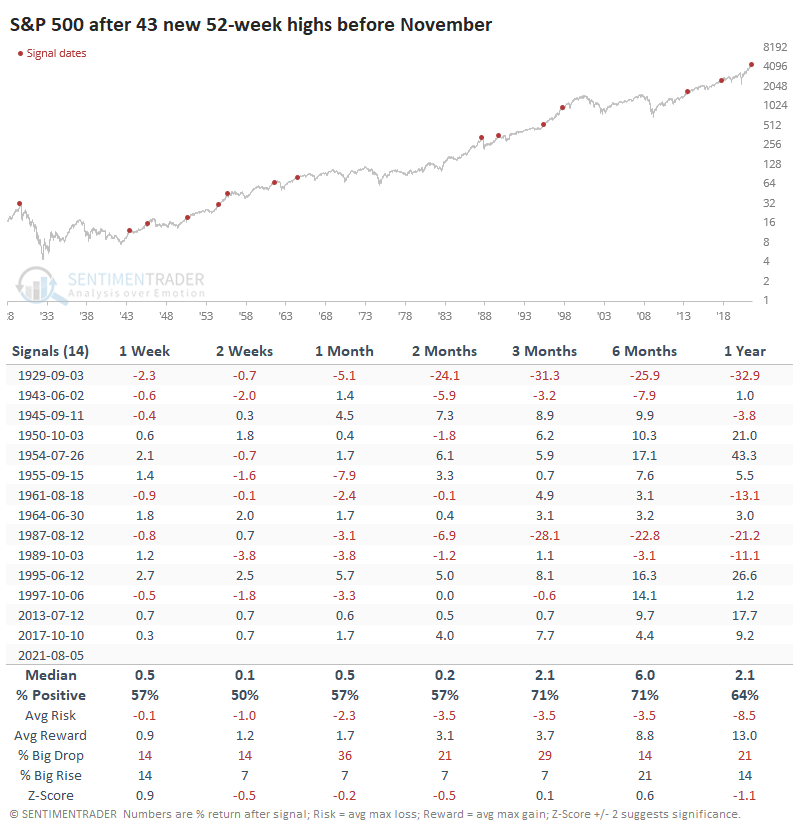
The S&P has also scored 43 days which closed at a 52-week high before November. Again, not a lot of consistency among forward returns after similar setups.
A YEAR WITH FEW PRECEDENTS
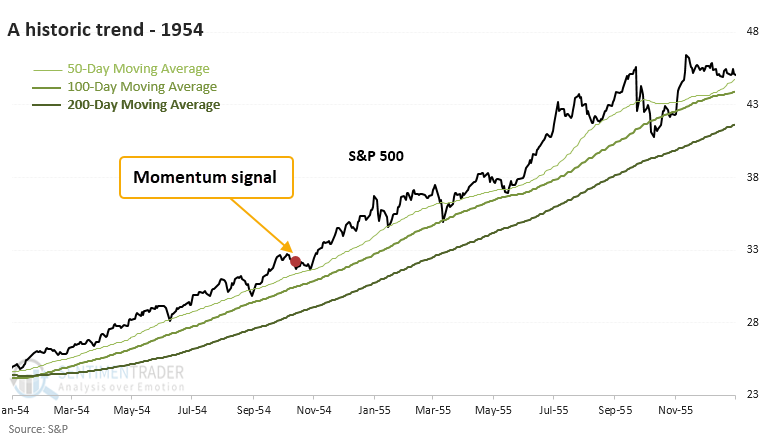
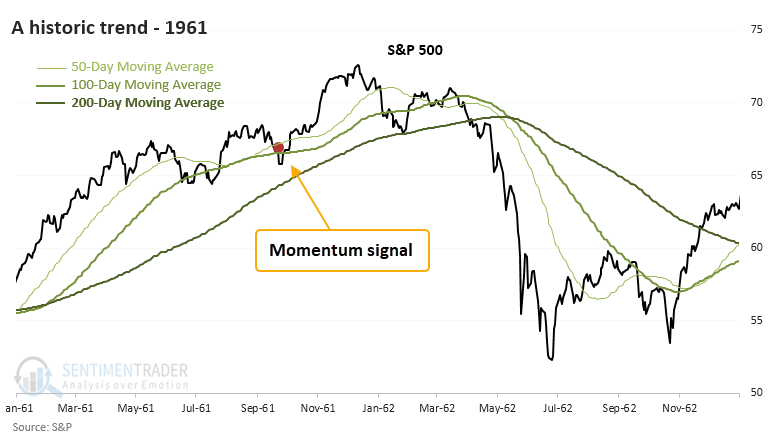
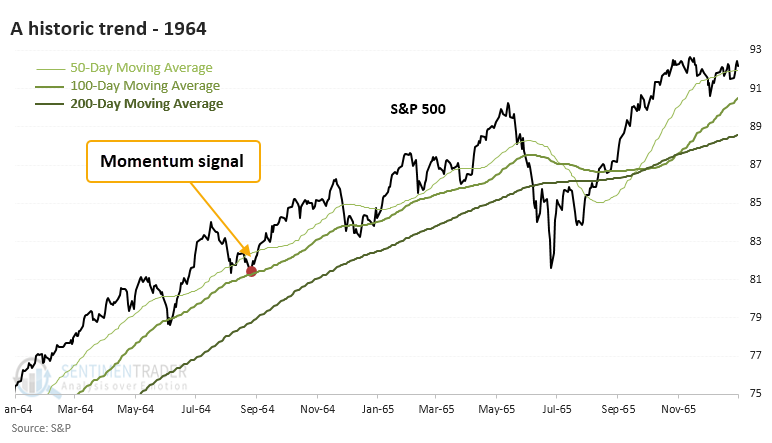
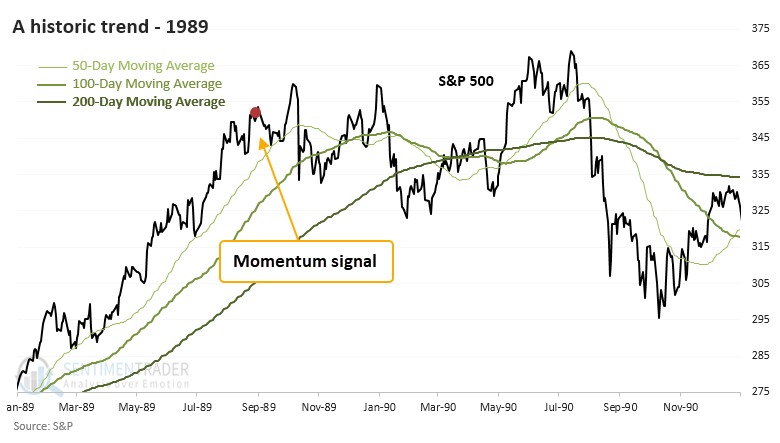
When we combine the two studies, this year has only a handful of precedents. Shorter-term returns were tepid, but the next few months were good, except for 1989 as we headed into the 1990 recession.
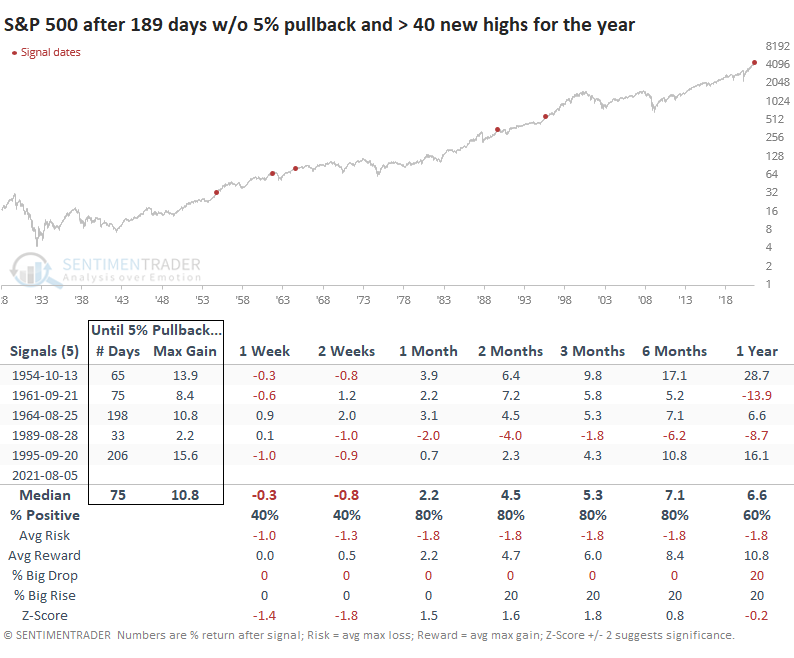
Once the S&P recorded this kind of momentum, it took an average of 75 trading days, and more than an additional 10% gain, before it fell into a 5% pullback. It took as short as 33 days and a 2.2% gain, and as long as 206 days (!) and 15.6% gain, so there was wide variability among them.
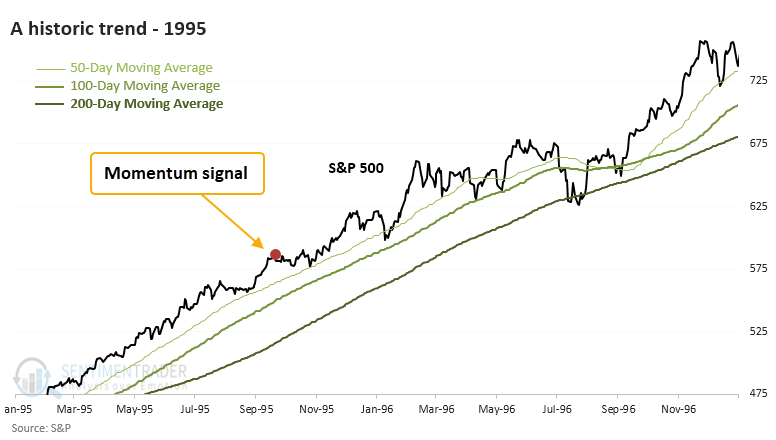
Looking at their trends individually, we can see that it typically didn't pay to get too concerned about a choppier environment until the index fell, and held, below its 200-day moving average.
This has been a remarkable year in a whole lot of ways. Things started to be obviously weird by late January - early February when we witnessed the peak of speculative excess and the "smartest" Dumb Money in 22 years.
Since then, it's been a choppy mess depending on where one is invested. In the broader, cap-weighted indexes, it's been a pristine ride higher, with trouble only visible under the surface. That trouble is normally enough to halt major gains in the indexes, but this year is throwing a wrench into historical comparisons in that regard.
If we focus just on the price action of the most benchmarked index in the world, then 2021 compares with some of the easiest years ever for investors. Those precedents suggest further good times ahead, with worries only when larger trend indicators start to fail.