Products
SentimenTrader Trading Tools
‍
Backtest Engine
My Trading Toolkit
Correlation Analysis
Seasonality
Indicators & Data API
‍
Proprietary Indicators & Charts
Market Data API
Strategies & Scanner
‍
50+ Trading Strategies
Smart Stock Scanner
Research Reports
‍
Research Solutions
Reports Library
Free Resources
Simple Backtest Calculator
Simple Seasonality Calculator
The Kelly Criterion Calculator
Sentiment Geo Map
Public Research Reports
Pricing
Company
About
In the News
Testimonials
Client Success Stories
Contact
Log inLoginSign up
< BACK TO ALL REPORTS

A bevy of big gains

Jason Goepfert
2021-04-22
Over the past year, the S&P 500 has enjoyed a record number of 1% daily gains versus 1% daily losses. Other periods with nearly as many big gains versus losses saw poor forward returns. Several sectors have joined the S&P with nearly as many gains vs losses.

Stocks have been running hot, and investors are responding. More and more extremes have been triggering, helping to push valuations high amid low volatility. 

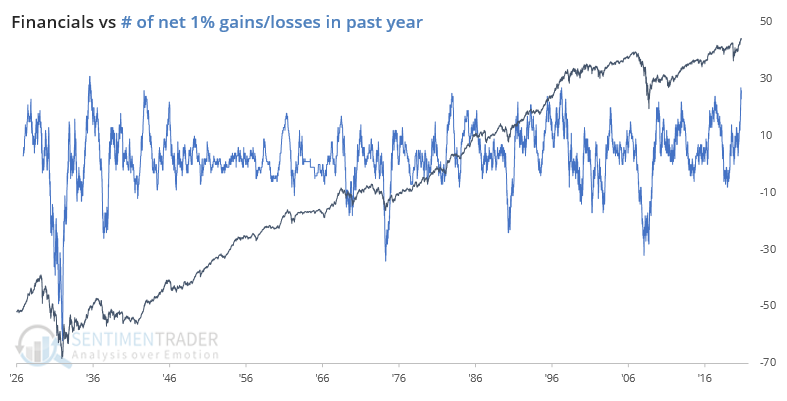
The past few weeks have only added to a historic run from the months before that. At various points during the past year, we've looked at streaks of large gains in the S&P or different sectors, and it's only gotten more remarkable. Even with a breather over the past couple of sessions, the S&P has never before seen a year with more +1% daily gains versus -1% losses.

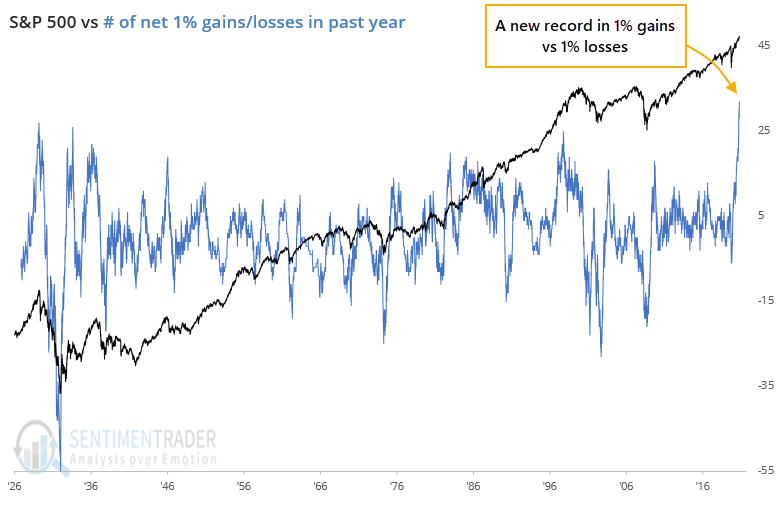
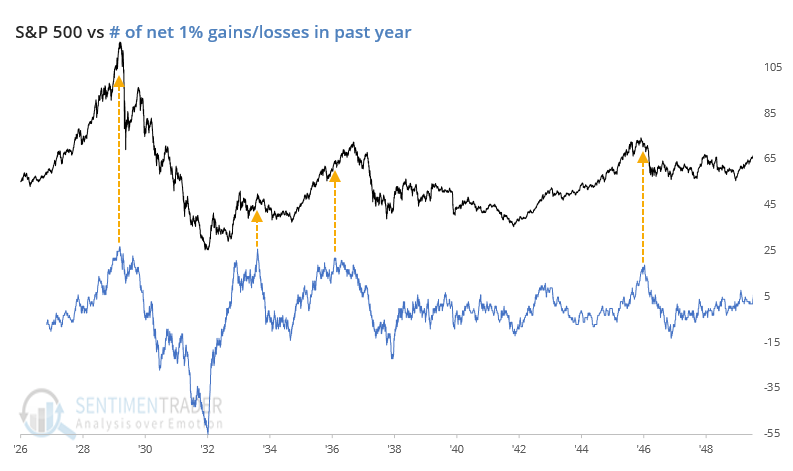
The past year has seen 32 more big gains versus losses, more than the net +27 days heading into September 1929, +26 days into February 1934, and +25 days into April 1998.

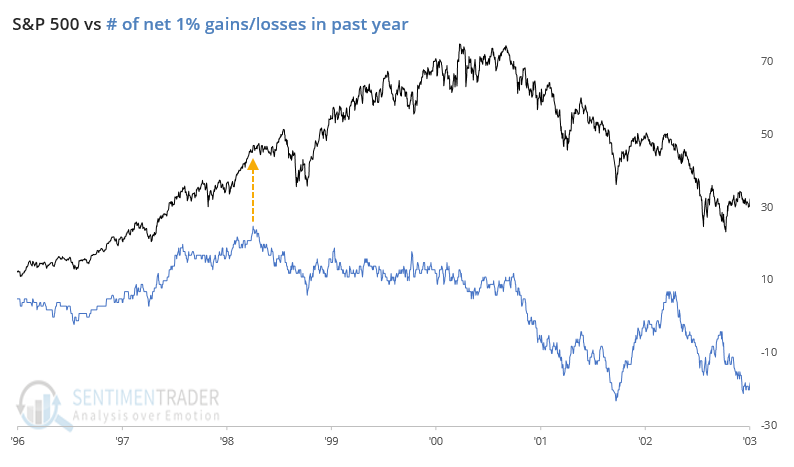
When we zoom in on the time periods that saw nearly as many big gains vs. losses as the past year, we can see how stocks struggled to hold the momentum.

The last instance, in 1998, preceded a very rocky period, but stocks didn't ultimately peak for a couple of years.

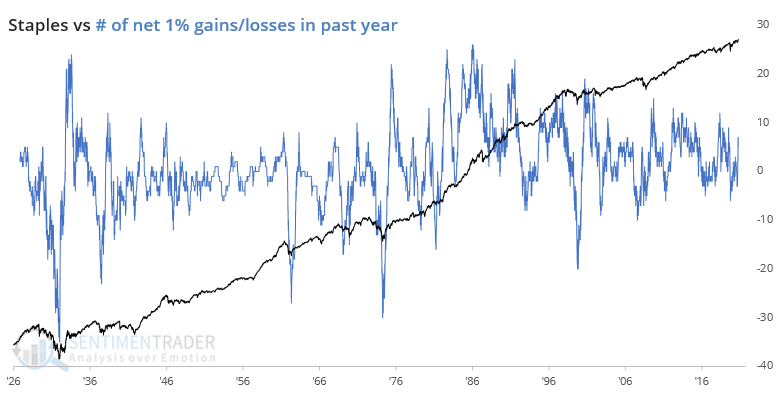
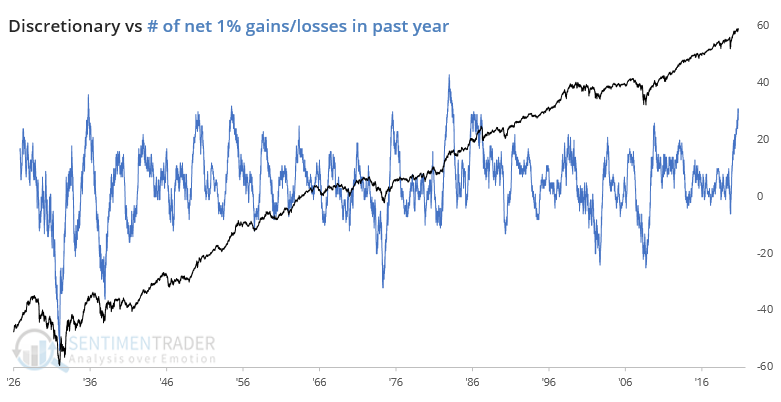
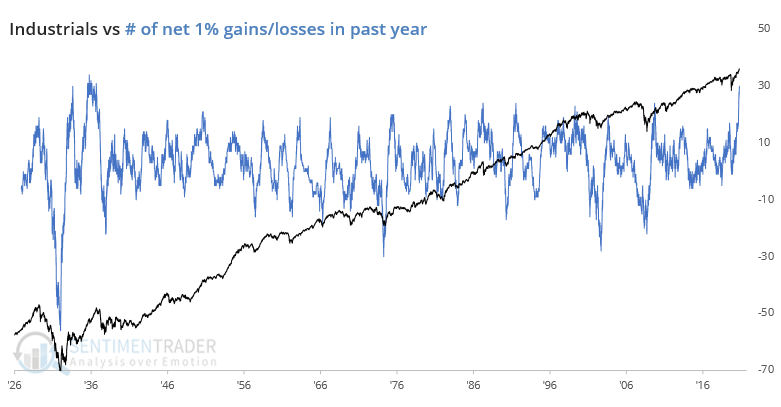
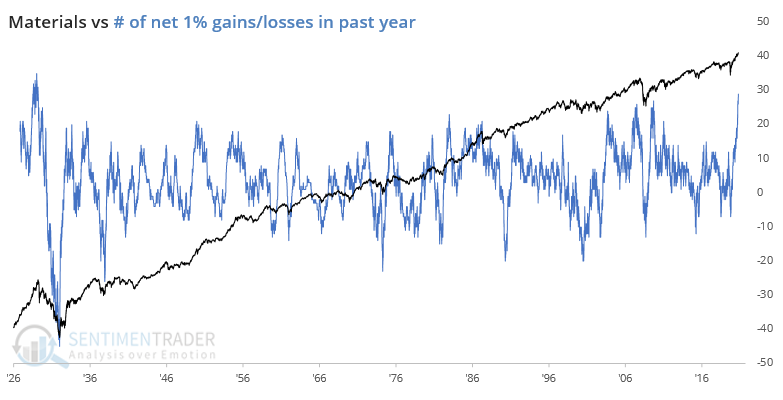
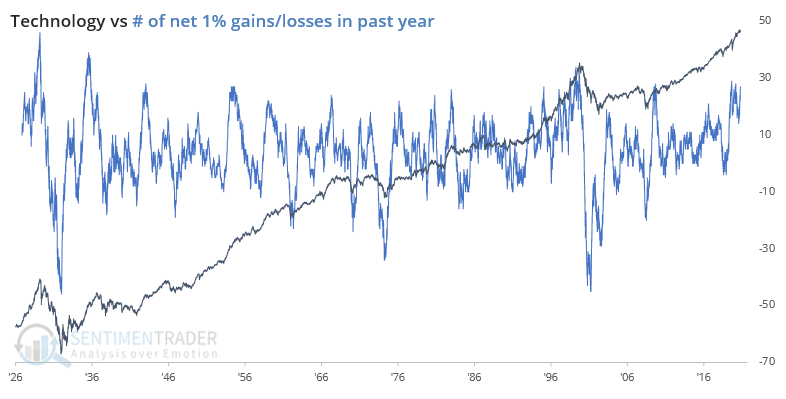
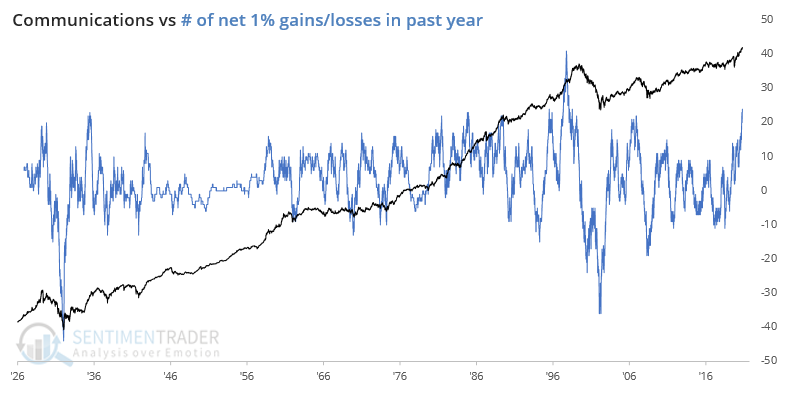
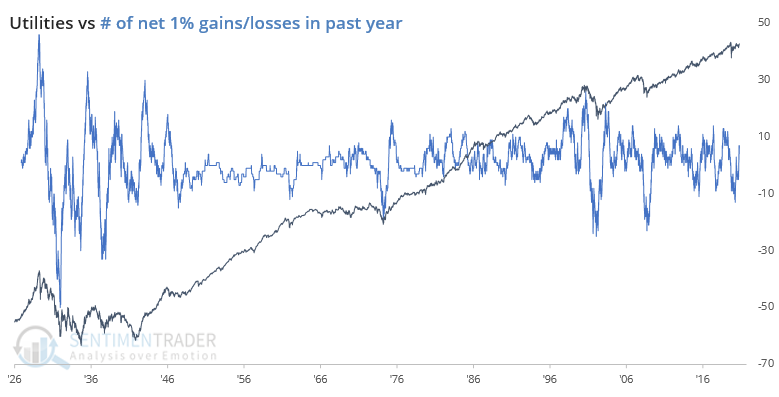
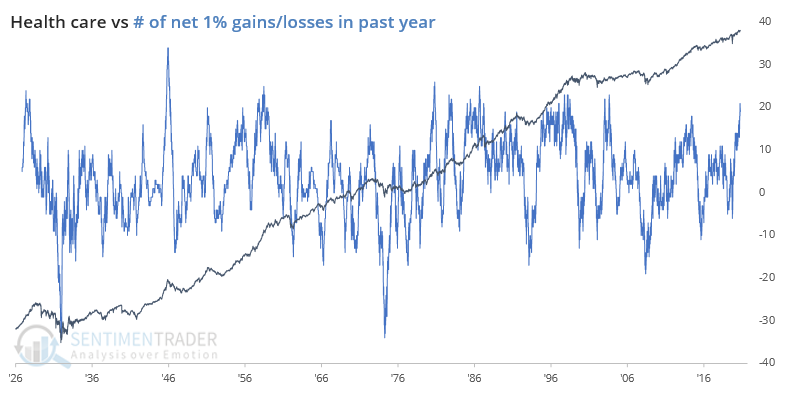
When we look at the major sectors, the ones that currently have a record or near-record net number of big positive days include Discretionary, Industrials, Materials, Communications, and Financials. For what it's worth, all of them preceded at least multi-month exhaustion points.

The past year has been a heady one for investors. One had to work hard to lose money, and those kinds of easy gains stoke complacency. Based on the record number of days with big gains that investors enjoyed offset by the small smattering of big losses, it's no wonder that we see sentiment at or near record levels.

Until very recently, momentum and internal participation have been good, even excellent. That helps to delay a reckoning from sentiment extremes. But essentially, every time that investors have been in an environment like this, with such easy gains, it has preceded at least months of poor or limited returns.

Sorry, you don't have access to this report

Upgrade your subscription plan to get access
Go to Dasboard
PRODUCTS
SentimenTrader
Trading Tools
Indicators & Data API
‍
Strategies & Scanner
‍
Research Reports
FREE
RESOUrCES
Simple Backtest
Calculator
Simple Seasonality
Calculator
The Kelly Criterion
Calculator
Sentiment Geo Map
‍
Public Research Reports
‍
Pricing
Bundle pricing
‍
Announcements
‍
FAQ
COMPANY
‍
About
‍
In the News
‍
Testimonials
‍
Client Success Stories
CONTACT
‍
General Inquiries
‍
Media Inquiries
‍
Financial Professionals Inquiries
‍
© 2025 Sundial Capital Research Inc. All rights reserved.
Setsail Marketing
TermsPrivacyAffiliate Program
Risk Disclosure: Futures and forex trading contains substantial risk and is not for every investor. An investor could potentially lose all or more than the initial investment. Risk capital is money that can be lost without jeopardizing ones’ financial security or life style. Only risk capital should be used for trading and only those with sufficient risk capital should consider trading. Past performance is not necessarily indicative of future results.

Hypothetical Performance Disclosure: Hypothetical performance results have many inherent limitations, some of which are described below. No representation is being made that any account will or is likely to achieve profits or losses similar to those shown; in fact, there are frequently sharp differences between hypothetical performance results and the actual results subsequently achieved by any particular trading program. One of the limitations of hypothetical performance results is that they are generally prepared with the benefit of hindsight. In addition, hypothetical trading does not involve financial risk, and no hypothetical trading record can completely account for the impact of financial risk of actual trading. for example, the ability to withstand losses or to adhere to a particular trading program in spite of trading losses are material points which can also adversely affect actual trading results. There are numerous other factors related to the markets in general or to the implementation of any specific trading program which cannot be fully accounted for in the preparation of hypothetical performance results and all which can adversely affect trading results.

Testimonial Disclosure: Testimonials appearing on this website may not be representative of other clients or customers and is not a guarantee of future performance or success.