Products
SentimenTrader Trading Tools
‍
Backtest Engine
My Trading Toolkit
Correlation Analysis
Seasonality
Indicators & Data API
‍
Proprietary Indicators & Charts
Market Data API
Strategies & Scanner
‍
50+ Trading Strategies
Smart Stock Scanner
Research Reports
‍
Research Solutions
Reports Library
Free Resources
Simple Backtest Calculator
Simple Seasonality Calculator
The Kelly Criterion Calculator
Sentiment Geo Map
Public Research Reports
Pricing
Company
About
In the News
Testimonials
Client Success Stories
Contact
Log inLoginSign up
< BACK TO ALL REPORTS

A big divergence in riskier stocks

Jason Goepfert
2021-04-21
A large number of stocks within the S&P 500 are holding above their 50-day moving averages. Within the Nasdaq Composite and Russell 2000, however, there are vastly fewer. There has never been a greater divergence.

For months, we've seen that sentiment has oscillated around extreme levels of optimism, yet stocks were holding firm. Not just the popular indexes, but most stocks, industries, sectors, even global markets.

That has started to shift in recent days.

It's too early to tell whether this can morph into something larger, but already there are splits that we haven't seen for a long time. As Bloomberg noted, around 80% of S&P 500 members are still holding above their 50-day moving averages, but within the Nasdaq Composite and Russell 2000, it is a vastly different story.

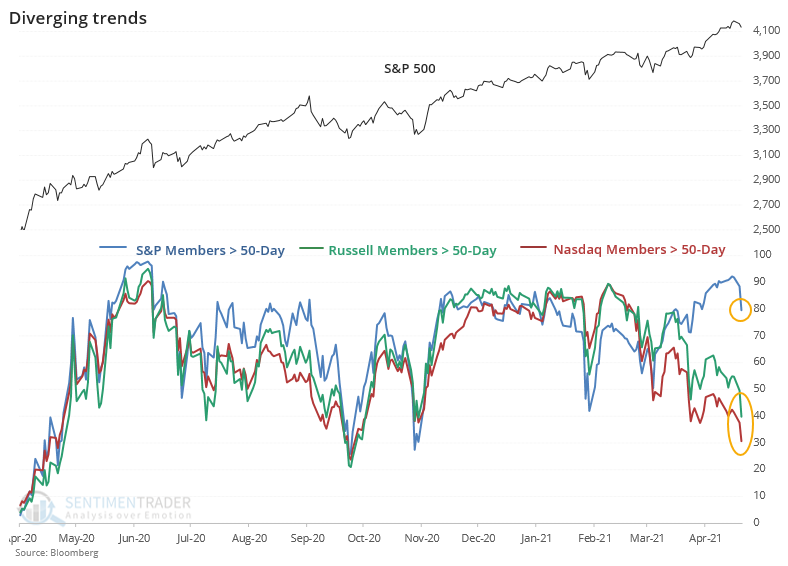
Going back more than 25 years, there has never been a day - until yesterday - when 80% of S&P 500 members were above their 50-day averages at the same time so few Nasdaq and Russell members were above their own averages. This is the widest such divergence in available history.

With Wednesday's rally, the picture didn't change much. The S&P had more than 85% of stocks above their 50-day averages, while both the Nasdaq Composite and Russell 2000 had fewer than 50% of members above their 50-day. That's never happened before.

To get a larger sample size, we have to relax the parameters. The table below shows each instance when 80% or more S&P members were above their averages, while fewer than 50% of Nasdaq and Russell members were above theirs.

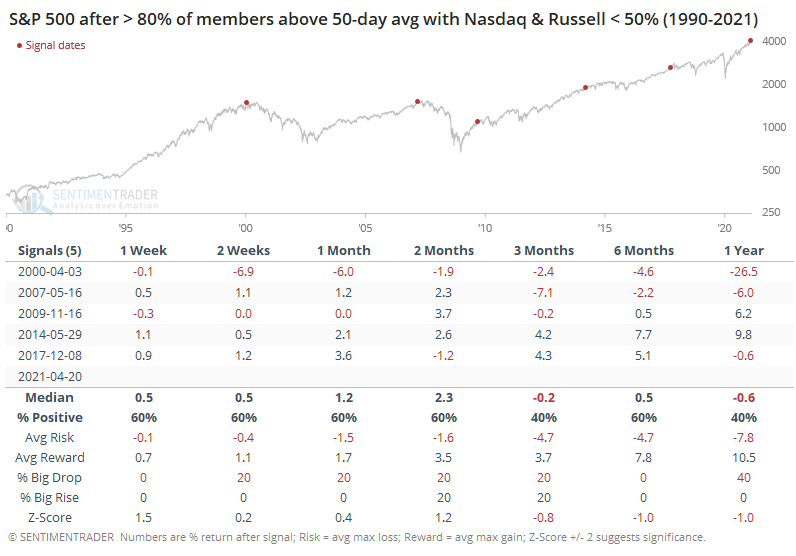
The overall results aren't too bad, but this is one of those times when the chart tells a better story than the numbers. It's pretty clear from the dots on the chart that these conditions wiped out any further gains in the S&P in the months. How long it took varied, from immediately to half a year, but it happened every time. Granted, the sample size is small but the message was consistent.

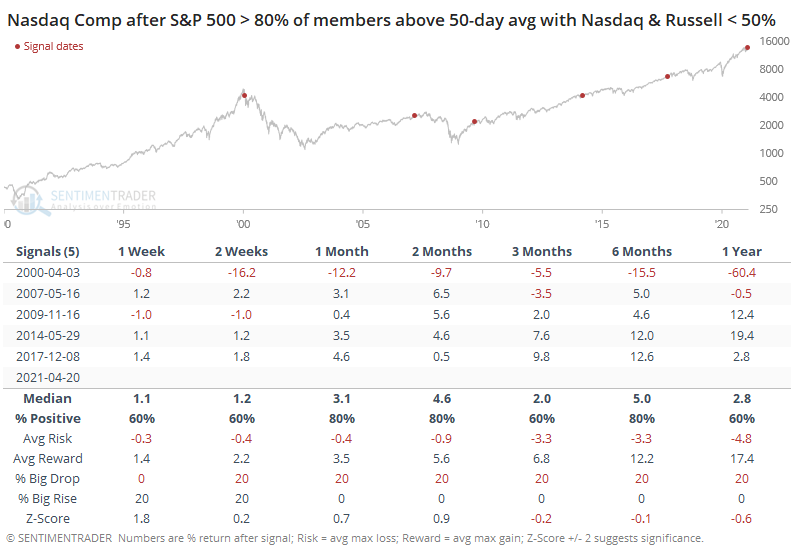
The Nasdaq Composite was a vaguely similar story, though it held up significantly better after the 2009, 2014, and 2017 signals. 

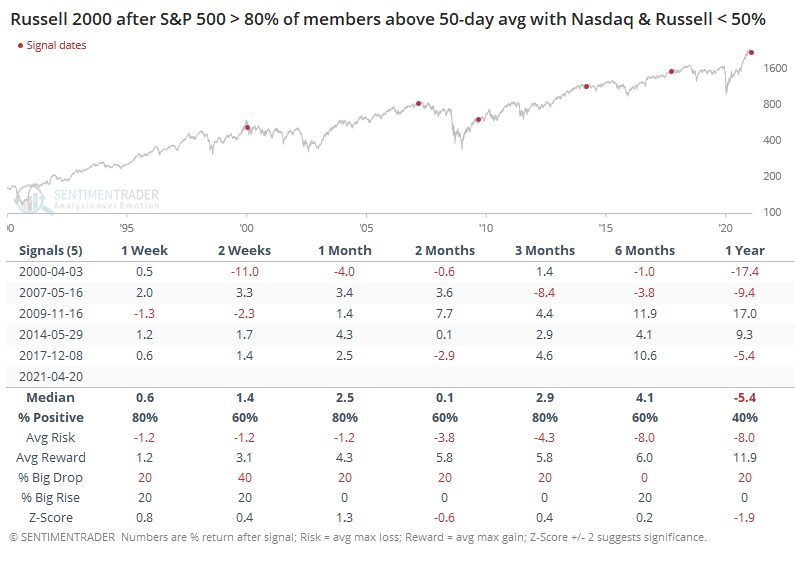
The small-cap Russell 2000 fared worse. It did manage to score sustainable gains in 2009, but the others saw some big losses.

We've been on the lookout for more sustained signs of deteriorating participation, and it's been like waiting for Godot. There have been isolated days with odd readings, usually thanks to the flood of SPACs or, lately, biotech stocks.

Shorter-term measures were about the only ones showing any kind of curious readings, and that's spreading now to some of the longer-term ones, which is more of a worry. There still haven't been widespread warning signs triggering, but if this kind of behavior continues, it's only a matter of time.

Sorry, you don't have access to this report

Upgrade your subscription plan to get access
Go to Dasboard
PRODUCTS
SentimenTrader
Trading Tools
Indicators & Data API
‍
Strategies & Scanner
‍
Research Reports
FREE
RESOUrCES
Simple Backtest
Calculator
Simple Seasonality
Calculator
The Kelly Criterion
Calculator
Sentiment Geo Map
‍
Public Research Reports
‍
Pricing
Bundle pricing
‍
Announcements
‍
FAQ
COMPANY
‍
About
‍
In the News
‍
Testimonials
‍
Client Success Stories
CONTACT
‍
General Inquiries
‍
Media Inquiries
‍
Financial Professionals Inquiries
‍
© 2025 Sundial Capital Research Inc. All rights reserved.
Setsail Marketing
TermsPrivacyAffiliate Program
Risk Disclosure: Futures and forex trading contains substantial risk and is not for every investor. An investor could potentially lose all or more than the initial investment. Risk capital is money that can be lost without jeopardizing ones’ financial security or life style. Only risk capital should be used for trading and only those with sufficient risk capital should consider trading. Past performance is not necessarily indicative of future results.

Hypothetical Performance Disclosure: Hypothetical performance results have many inherent limitations, some of which are described below. No representation is being made that any account will or is likely to achieve profits or losses similar to those shown; in fact, there are frequently sharp differences between hypothetical performance results and the actual results subsequently achieved by any particular trading program. One of the limitations of hypothetical performance results is that they are generally prepared with the benefit of hindsight. In addition, hypothetical trading does not involve financial risk, and no hypothetical trading record can completely account for the impact of financial risk of actual trading. for example, the ability to withstand losses or to adhere to a particular trading program in spite of trading losses are material points which can also adversely affect actual trading results. There are numerous other factors related to the markets in general or to the implementation of any specific trading program which cannot be fully accounted for in the preparation of hypothetical performance results and all which can adversely affect trading results.

Testimonial Disclosure: Testimonials appearing on this website may not be representative of other clients or customers and is not a guarantee of future performance or success.