
A Bullish Play and a Bearish Play on Long-Term Bonds

PART I: A BULLISH PLAY ON LONG-TERM BONDS
What follows should NOT be considered a "recommendation." The information is intended solely to provide an example of one way (of many) to play a particular speculative situation.
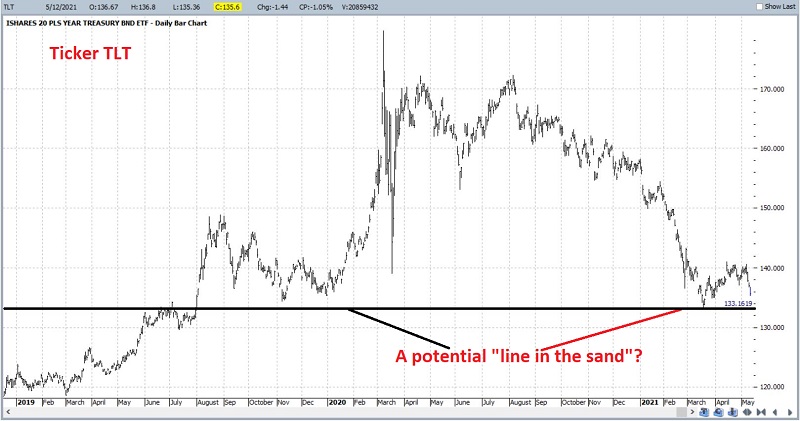
As you can see in the chart below (courtesy ProfitSource by HUBB), ticker TLT (iShares 20+ Year Treasury Bond ETF) has declined significantly in the past 13+ months. Given the established downtrend and inflation now confirmed to be rising, most investors steer clear of the long treasury bond. And seemingly for good reason.
However, this very scenario - "When everybody knows" to avoid a certain situation - often sets the stage for a contrarian opportunity.
Let's consider some other factors:
- In the chart above, we can also see an important "line in the sand," i.e., the support level for TLT at roughly $133-134
- In the chart below, we can also see that 30-year bonds have entered a seasonally favorably time of year
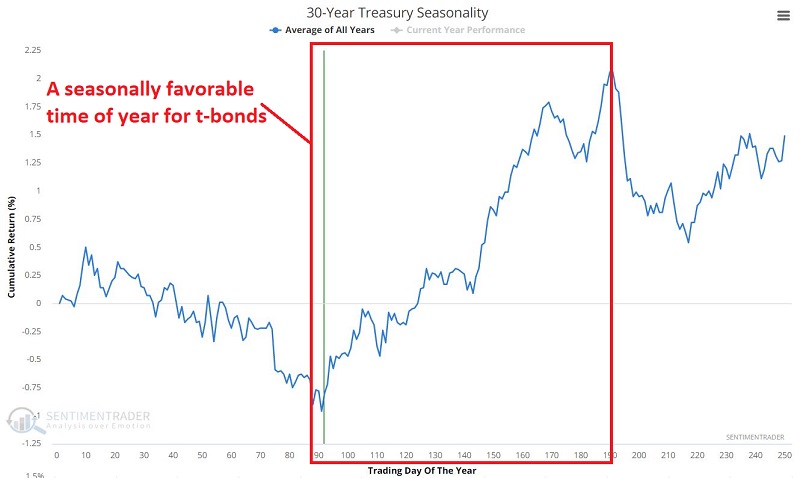
It is fair and important to note that this seasonally favorable period has mostly been carved out during a long-term bull market for bonds. Likewise, there is never any guarantee that a given seasonal trend will play out as expected "this time around." So one cannot and should not assume that long treasuries are certain to power higher in the months ahead. Still, a trader with a speculative bent might find this to be an interesting contrarian bet.
MAKING THE BULLISH PLAY
The most straightforward approach would be to buy 100 shares of TLT. However, at its current price, this would require a commitment of over $13,600. For a speculative bet, it is ideally better to commit and risk far less. So, let's look at one simple way to approach this situation.
BUYING A CALL OPTION
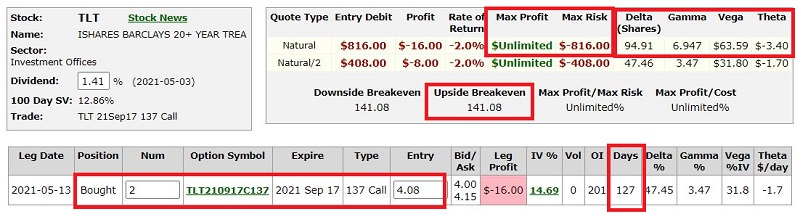
One example alternative would be to buy two September 2021 TLT 137 strike price calls @ $4.08.
The screenshot below (courtesy of www.Optionsanalysis.com) displays the particulars.
Things to note:
- The Sep137 call has a delta of 47.45, so buying 2 calls gives us a net delta of 94.91 (This suggests that this position will behave much like a position holding long 95 shares of ticker TLT - at a fraction of the cost)
- The total cost to enter this trade is $816 (versus $13,600 to buy 100 shares of TLT). This also represents the maximum risk on the trade
- The trade has a "Vega" of $63.59 (this means that for every one-point increase in implied options volatility, this position will increase in value by that amount and vice versa if implied volatility declines)
- This trade has a "Theta" of -$3.40 (this means that time decay will eat away a portion of this position's value each day due solely to the passage of time)
- The Breakeven Price at the time of September expiration is $141.08 (this equals the strike price of 137 plus the premium paid of $4.08)
- This trade has 127 days left until expiration (in other words, we have 4 months for TLT to work higher)
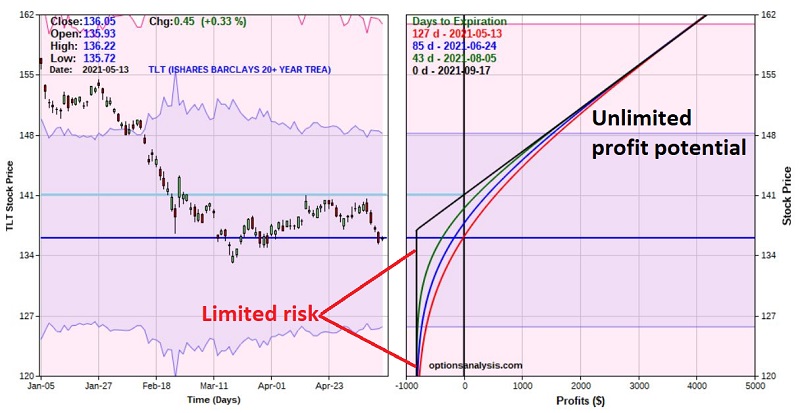
The chart below displays the risk curves for this trade.
- The black line represents the expected dollar gain or loss as of the day the option expires
- The colored lines represent the expected dollar gain or loss as of a particular date before expiration
What you see in this chart is the effect of time decay as the profit potential/expected loss changes (i.e., gets worse) as time goes by.
The table below displays the expected Profit/Loss for this option position:
- As of a given # of days before expiration ("Days Left to Expiration")
- At a given price for ticker TLT ("Stock Close")
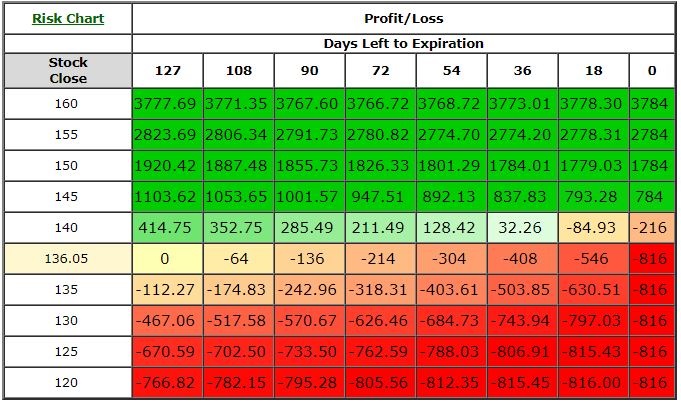
The implications are pretty straightforward:
- If TLT DOES rally, this position can generate substantial profits
- If TLT DOES NOT rally, this position will absolutely, positively lose money
- Regardless of how far TLT falls if it does decline, this trade can lose no more than $816
PART II: A BEARISH PLAY ON LONG-TERM BONDS
I wrote above about an example trade for a trader who wanted to take a contrarian position and bet on a rebound for long treasuries. This article will take the opposite tack and consider an example trade that can profit if the downtrend of the last year continues.
As with the previous article, what follows should NOT be considered a "recommendation." The information is intended solely to provide an example of one way (of many) to play a particular speculative situation.
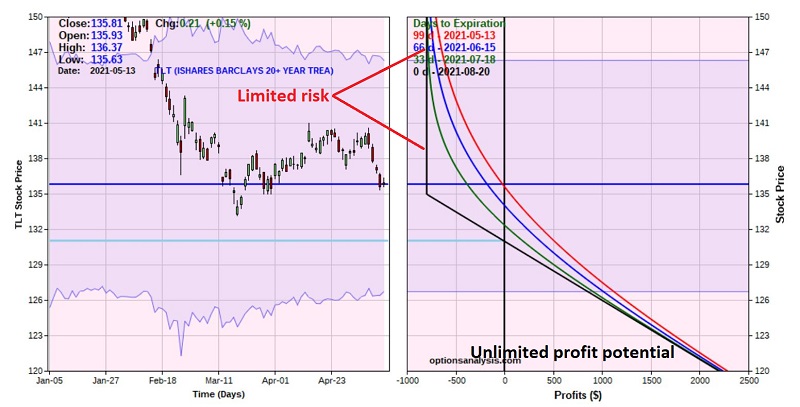
As you can see in the chart below (courtesy ProfitSource by HUBB), ticker TLT (iShares 20+ Year Treasury Bond ETF) has declined significantly in the past 13+ months. On a trend-following basis, we see that:
- The current price is below the 50-day moving average
- The current price is below the 200-day moving average
- The 50-day moving average is below the 200-day moving average
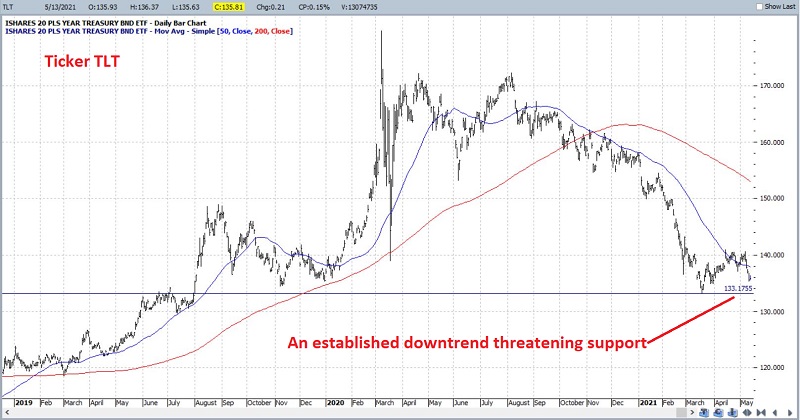
While no market goes straight down forever and countertrend rallies are normal, TLT is in a classic downtrend from a trend-following point-of-view. Further adding to this outlook, in the chart below, we see that the Elliott Wave count (as drawn using the objective algorithm built into ProfitSource by HUBB) is projecting a potential move to new lows during June-July timeframe.
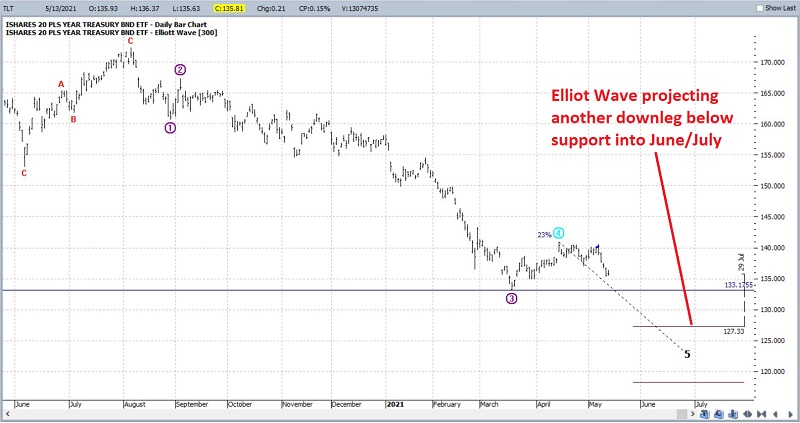
Based on these criteria, a trader might decide to play the short side of TLT.
MAKING THE BEARISH PLAY
The most straightforward approach would be to sell short 100 shares of TLT. However, this would require a substantial margin requirement at its current price and technically entails unlimited risk. In this instance, we are more interested in a low-cost speculative bet affording us less capital commitment and risk far less. So, let's look at one simple one to approach this situation.
BUYING A PUT OPTION
If we rely on the Elliott Wave projection, we want a position that will profit if TLT moves lower sometime between the first of June and the end of July. So, we can consider August 2021 options that expire on 8/21/2021 (99 days from the date of entry).
One example alternative would be to buy two August 2021 TLT 136 strike price puts @ $3.98
The screenshot below (courtesy of www.Optionsanalysis.com) displays the particulars.
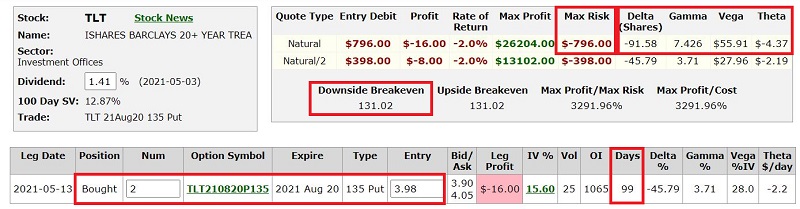
Things to note:
- The Aug135 put has a delta of -45.79, so buying 2 puts gives us a net delta of -91.58. This suggests that this position will behave much like a position holding short 92 shares of TLT
- The total cost to enter this trade is $796 (versus the margin requirement involved in selling short 100 shares of TLT). This also represents the maximum risk on the trade
- The trade has a "Vega" of $55.91 (this means that for every one-point increase in implied options volatility, this position will increase in value by that amount and vice versa if implied volatility declines)
- This trade has a "Theta" of -$4.37 (this means that time decay will eat away a portion of this position's value each day due solely to the passage of time)
- The Breakeven Price at the time of September expiration is $131.02 (this equals the strike price of 135 minus the premium paid of $3.98)
- This trade has 99 days left until expiration (in other words, we have roughly 3 months for TLT to work lower)
The chart below displays the risk curves for this trade.
- The black line represents the expected dollar gain or loss as of the day the option expires
- The colored lines represent the expected dollar gain or loss as of a particular date before expiration
What you see in this chart is the effect of time decay as the profit potential/expected loss changes (i.e., gets worse) as time goes by.
The table below displays the expected P/L for the option position:
- As of a given # of days before expiration
- At a given price for ticker TLT
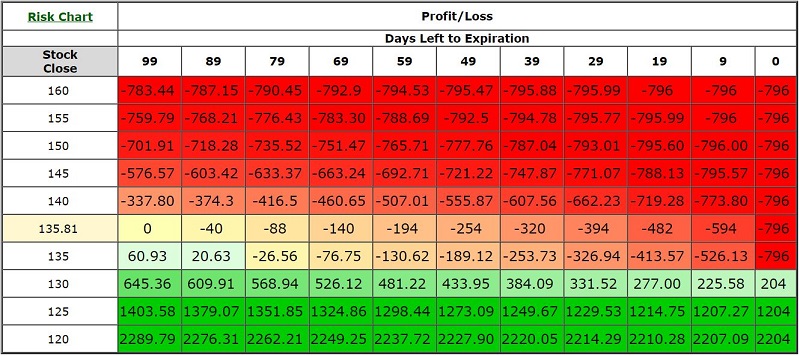
The implications are pretty straightforward:
- If TLT DOES decline in price, this position can generate substantial profits
- If TLT DOES NOT decline in price, this position will lose money
Regardless of how far TLT rises if it does advance, this trade can lose no more than $798
SUMMARY
I am agnostic on the outlook for t-bonds, and as I said at the outset, the trades detailed above are mere "examples" and NOT "recommendations." The purpose of this article is to help traders to recognize the potential for speculating on certain situations via the use of options. Having the potential to enter a trade with a significantly lower cost and dollar risk than simply buying shares opens up a world of possibilities for traders who have confidence in their ability to pick the right side of a given market.