
A cluster of technical warning signs suggests long term caution

Key points:
- There has been a cluster of technical warnings on the NYSE and Nasdaq exchanges
- Every time these clusters occurred, stocks suffered
- Friday's session wasn't enough to satisfy their usual patterns
Silly names, but a respectable history
Everyone's favorite technical punching bag is back. Non-technical market people love to make fun of warnings like the Hindenburg Omen. The hyperbolic name, combined with the occasional failure, makes it a go-to source of comedy for those opposed to technical analysis, market history, and data mining.
The trouble with those people is they suffer from recency bias and a whole host of other cognitive delusions. There is no doubt that the Hindenburg Omen and its cousin the Titanic Syndrome were born out of a data-mining fever dream. Even so, they've been functioning in real-time for decades and have proven their use.
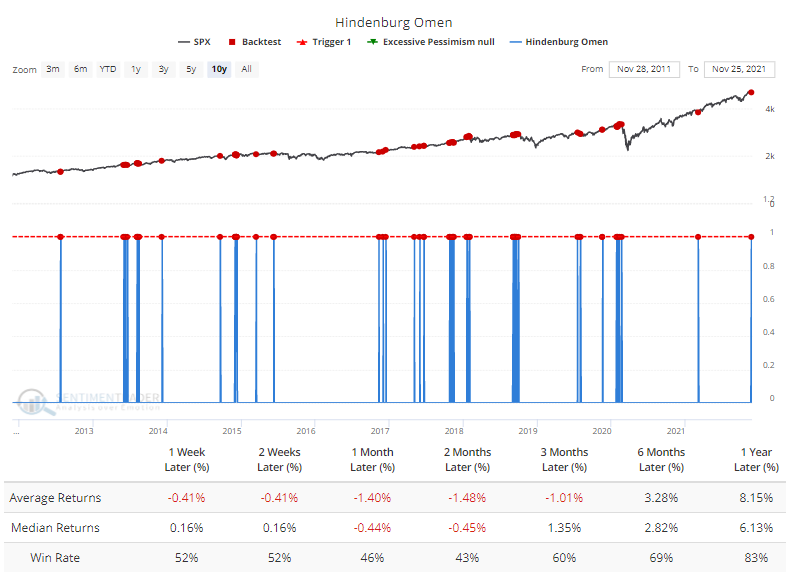
Even during the past decade of one of the strongest, most durable, most persistent bull markets of all time, a single Hindenburg Omen warning preceded fragile returns over the medium-term in the S&P 500, according to the Backtest Engine.
A historic cluster of warning signs
Single warning signs, like we saw in March, are less of a worry. It's a more significant issue when we see multiple days of warnings and on more than a single exchange.
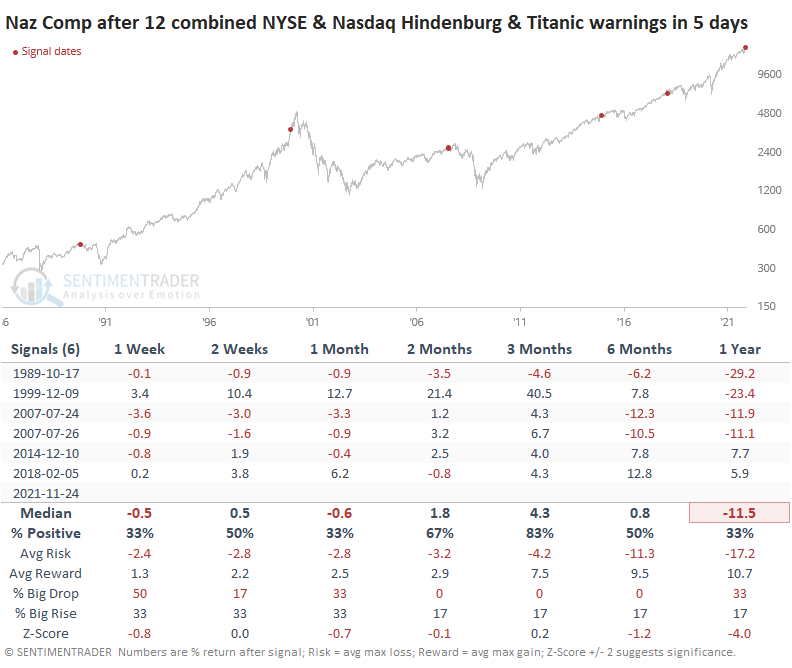
This is a problem now because they've been firing consistently lately, ahead of Friday's carnage. In just 5 days, a combined 12 warning signs have triggered between the NYSE Hindenburg Omen, Nasdaq Hindenburg Omen, NYSE Titanic Syndrome, and Nasdaq Titanic Syndrome.
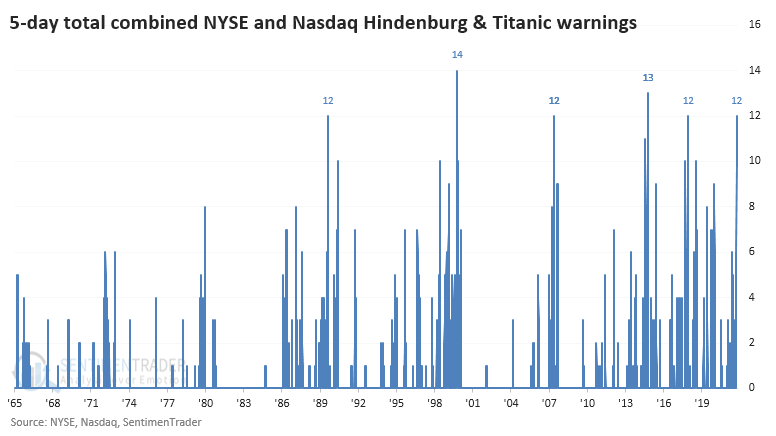
It's been rare to see such a big cluster of warnings across both exchanges over the past 25 years. The handful of times these clusters popped up, the S&P 500 had a tough time holding any upside momentum.
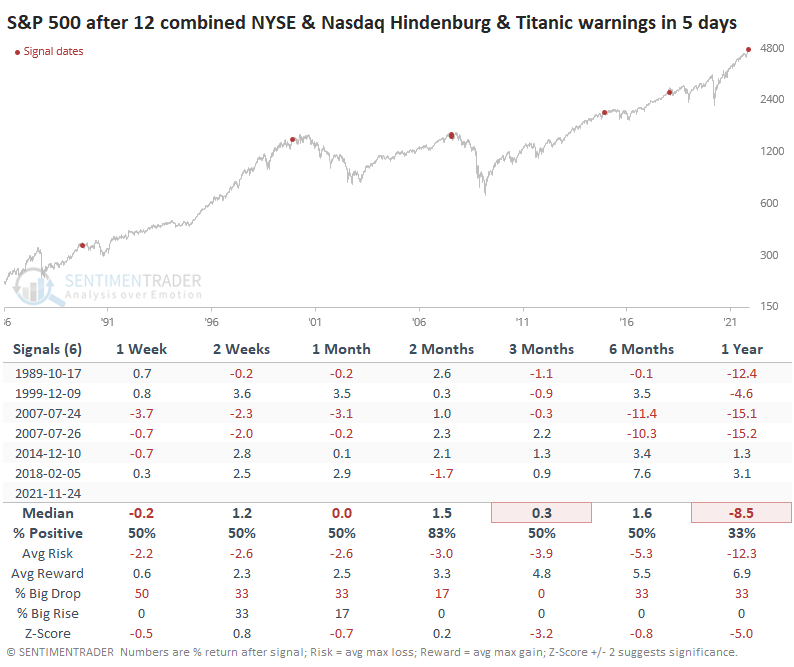
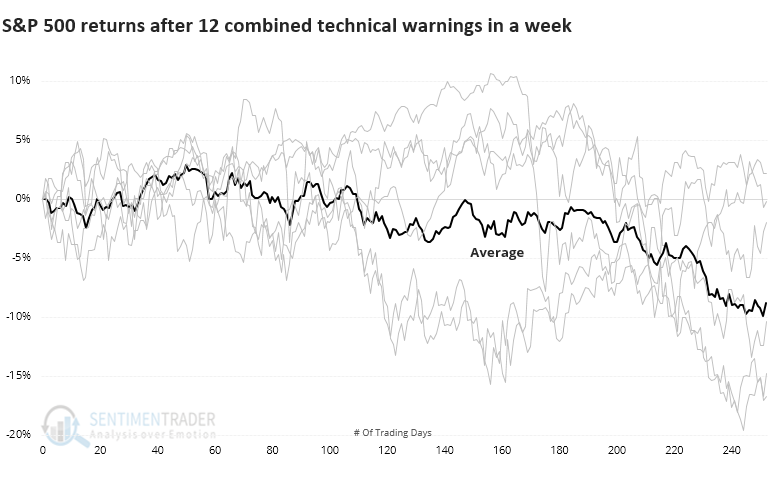
When we look at the price path of the S&P after each of the signals, we can see that there was quite a bit of variability, especially over the next 6 months or so. The average was negative, and all of the signals eventually sagged as time elapsed.
Not many places to hide, other than Defensive stocks
If we look at returns in the Nasdaq Composite, returns were more volatile, as we should expect. In 1999, the index roared higher as it entered the blow-off phase of the bubble, but long-term returns were still poor.
Among sectors and factors, there weren't many places to hide after these warning clusters. Defensive stocks held up the best over the next year, with decent returns in Staples, Utilities, and Health Care.
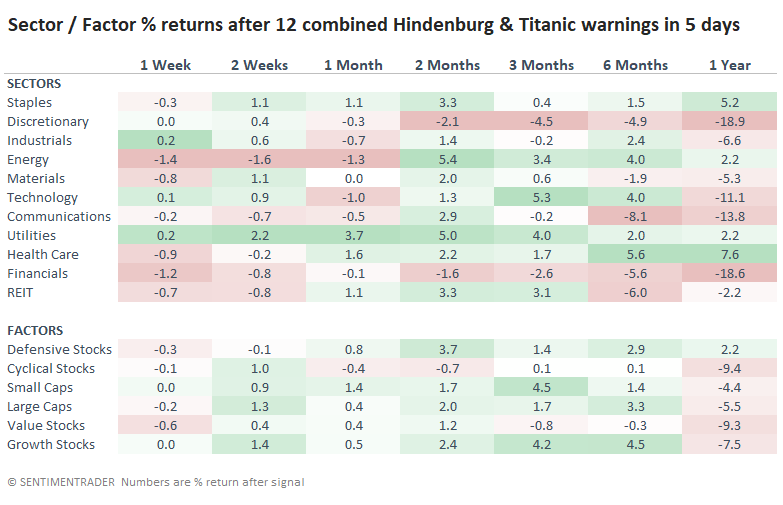
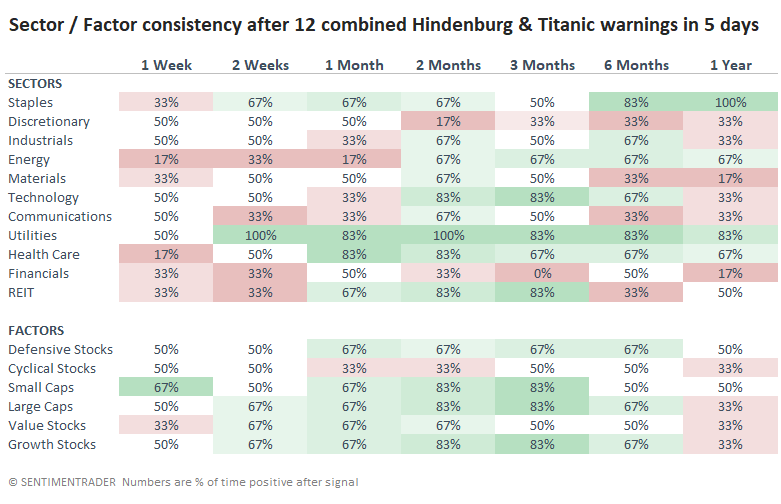
If we look at their win rates, Staples were higher 100% of the time a year later, with Utilities not far behind. The most consistent losers were Materials and Financials.
What the research tells us...
Breadth among stocks has gone through isolated bouts of being questionable this year and then quickly recovered. As we headed into the Thanksgiving holiday, a broader and more severe sense of weakness was underlying the indexes. A single day of selling pressure like Friday usually isn't enough to satisfy the weakness that signals like this typically precede. Nor do they mean an imminent and protracted decline. They are, however, a consistent warning that long-term returns in the indexes have suddenly become more suspect.