
A 'double' Zweig Breadth Thrust just as we hit the worst six months

We spent a lot of time in March looking at the massive thrusts in buying pressure. Because of the historic volatility, the thrusts didn't necessarily meet the classic definitions of what a "breadth thrust" is supposed to be. As we saw at the time, it didn't matter that we didn't meet those optimized conditions. The simple fact that we were seeing massively skewed buying interest was a positive sign, especially longer-term.
Stocks have continued to rise, at least through Wednesday. And buying pressure has continued to be impressive. For the 2nd time in less than a month, the 10-day exponential moving average of the NYSE Up Volume Ratio, typically used to define a Zweig Breadth Thrust (ZBT), has moved above the upper threshold.
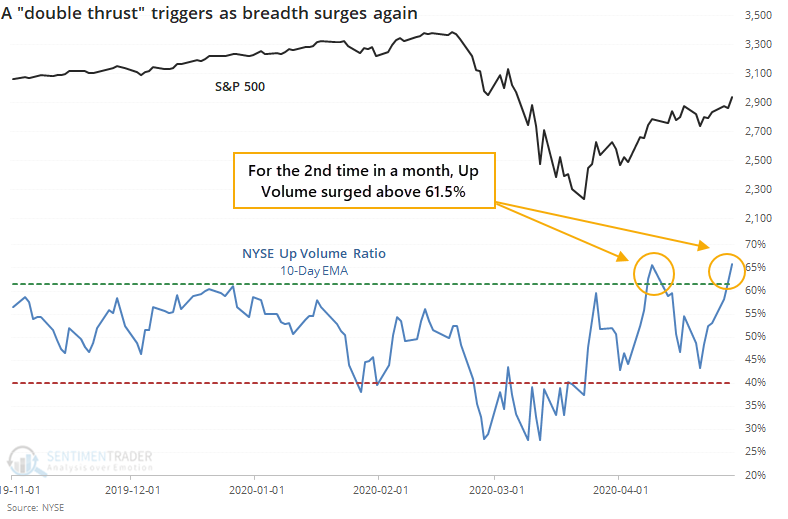
When we've seen a second surge in up volume after a ZBT was triggered has mostly served as confirmation that there was an important longer-term shift occurring, especially when it came after a protracted downtrend.
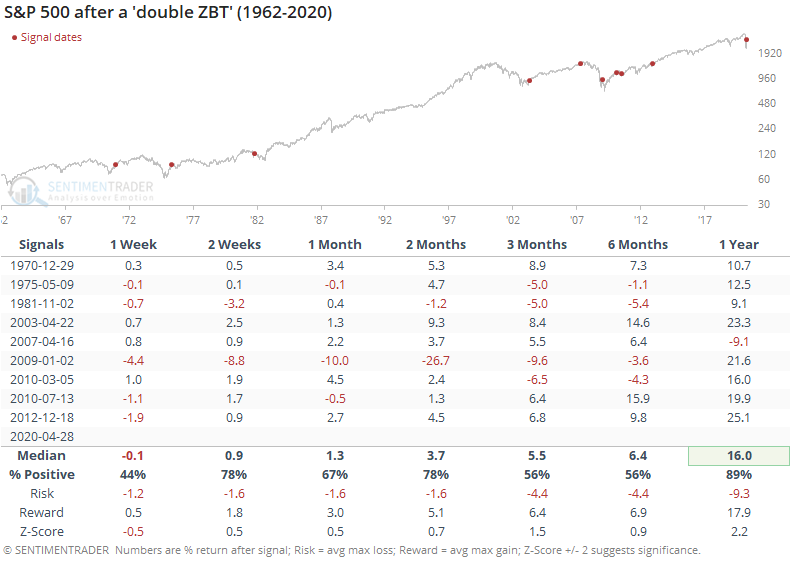
This triggered too early in the recovery in 1981 and 2009, even though long-term returns were still good. It led to a drop after it triggered in 2007, but that was when stocks were near a high, and not after a protracted downtrend.
This doesn't say much about the short- to medium-term, as stocks often had to digest all of that buying pressure. Even over the next 6 months, returns were mixed. But over the long-term of a year or more, this should be another positive sign.
Those next 6 months could be a challenge based on the calendar. We've all heard about 'sell in May and go away' and it has been particularly acute during down years. When the S&P 500 was down at least 5% year-to-date through April, the months ahead were skewed more toward risk and less toward reward.
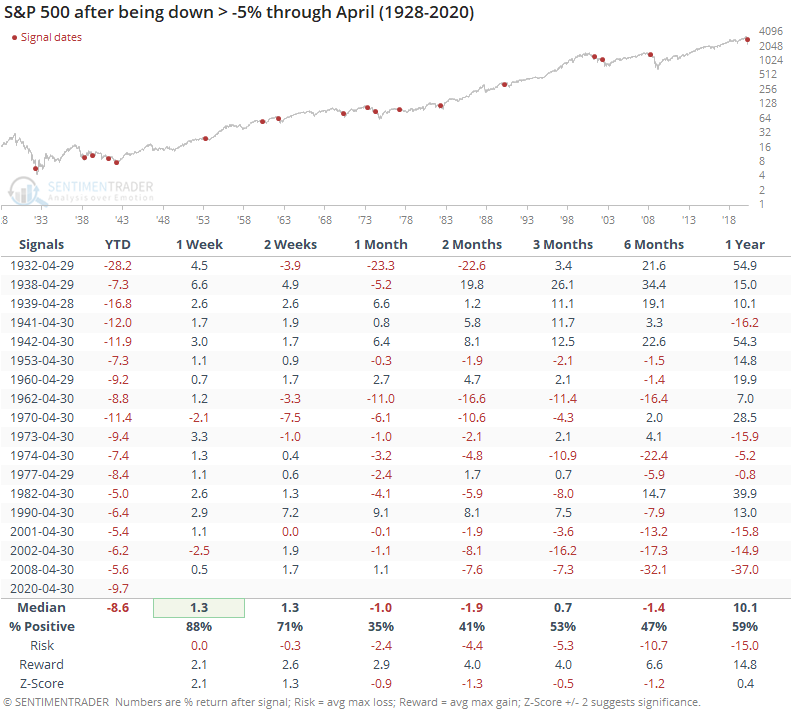
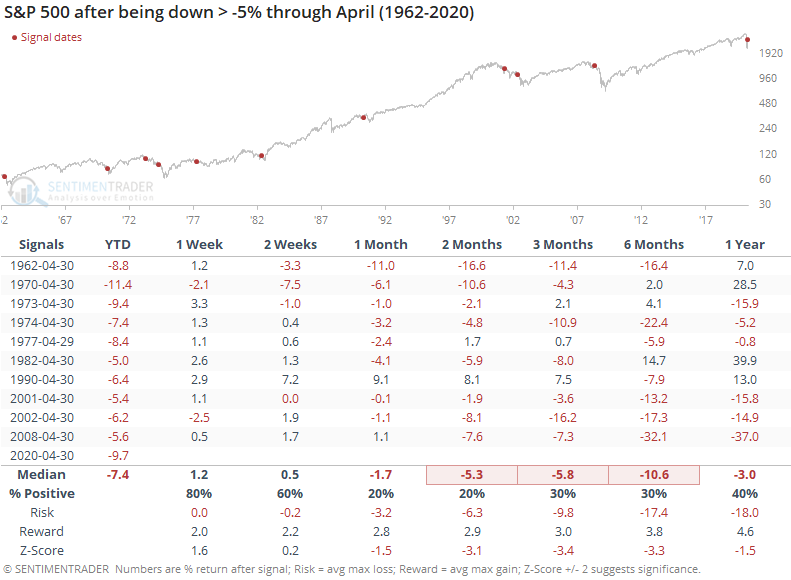
It has been particularly dastardly over the past 60 years. The next 2-6 months were not pleasant.
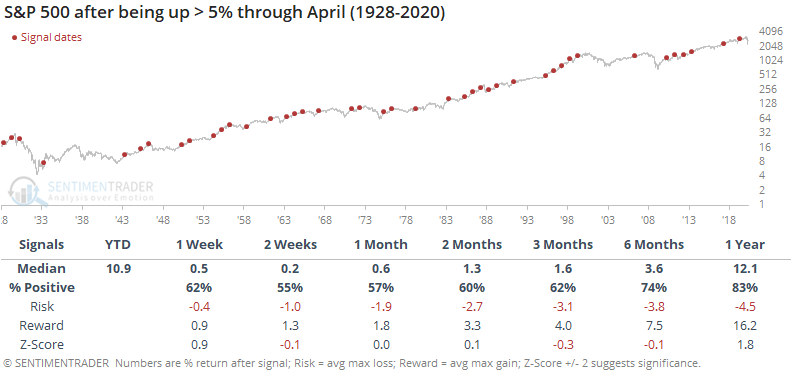
Contrast that to the returns during the 42 years when the S&P was up at least 5% through April.
When the S&P was down 5% or more heading into the summer, the next 6 months averaged -1.4% with a 47% win rate, compared to an average of +3.6% and 74% win rate during up years.
We'd give much more weight to breadth than seasonality, but even the thrusts didn't lead to consistent upside within the next half year. It suggests that upside over the summer months might be hard to come by.