
A global recovery that's almost unmatched

There has been tension between the main focal points of our work for months now. In almost 20 years of publishing, this tension has never been so pronounced, or so prolonged.
Our main focus is sentiment. While there are always odd outlier indicators, there is little question that starting in December and arguably continuing today, we're seeing some of the most speculative behavior we have in a generation.
Another main focus is breadth and momentum. Those two forces are the main opposition to sentiment extremes, and when they are of high quality, they can swamp sentiment extremes for long stretches.
We've been watching carefully for months to see if the extremes in sentiment would lead to a deterioration in participation among stocks and bonds underlying the main indexes. So far, there have been only isolated pockets, and just when it seems like we would get major warning bells, the market recovered.
And how.
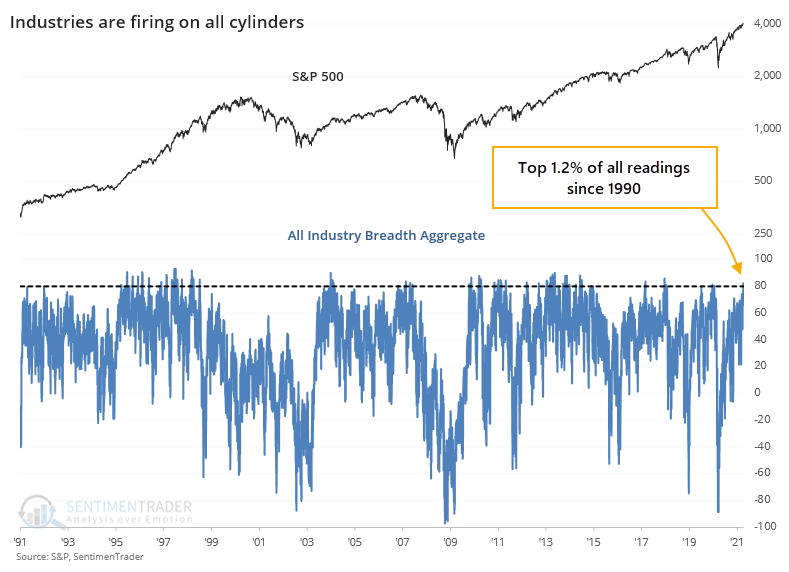
We track some unique breath measures, not only looking at stocks within indexes but also indexes within groups. And in the past couple of days, those have reached near-record impressiveness. Among industries, sectors, and global indexes, we are now seeing among the best participation on record.
This is judged by "positive" metrics:
- Percentage above 10-day moving average
- Percentage above 50-day moving average
- Percentage above 200-day moving average
- Percentage at 52-week highs
And by "negative" ones:
If we average all the positive metrics and subtract the negative ones, then we can get a breadth aggregate. For the 20+ major industries in the U.S., this aggregate just hit +80, among the highest readings in 30 years.
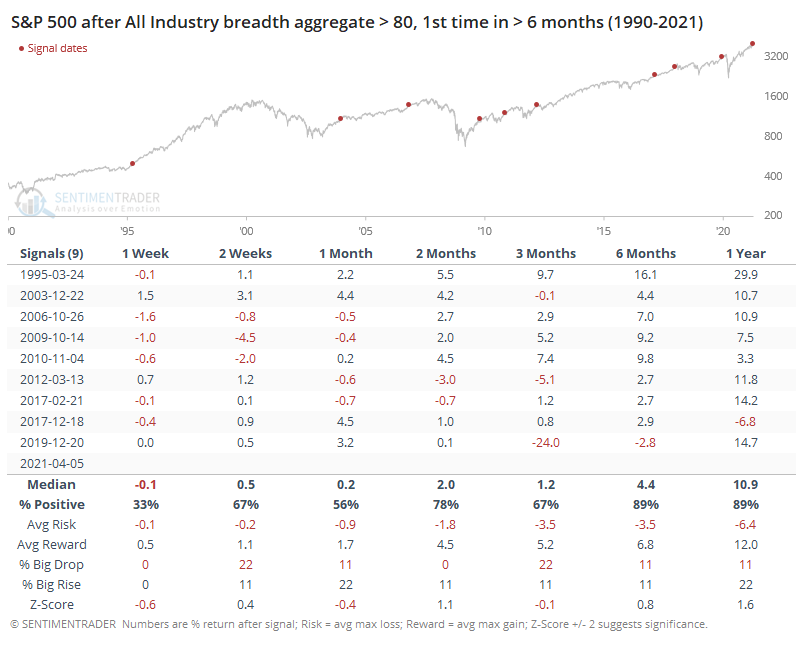
When this figure first exceeded +80 for the 1st time in at least 6 months, forward returns in the S&P 500 were very good over the medium- to long-term. The shorter-term saw some of the gains digested first, and the ones that triggered in the past decade saw more questionable returns than prior signals.
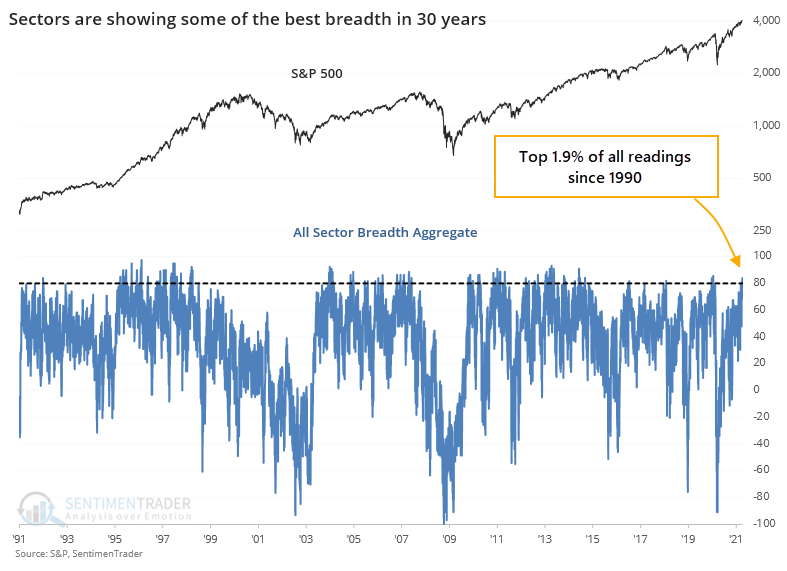
It stands to reason that if most industry indexes are performing well, then the 10 major sectors (excluding REITs) are as well. It's almost the same graph, but not quite.
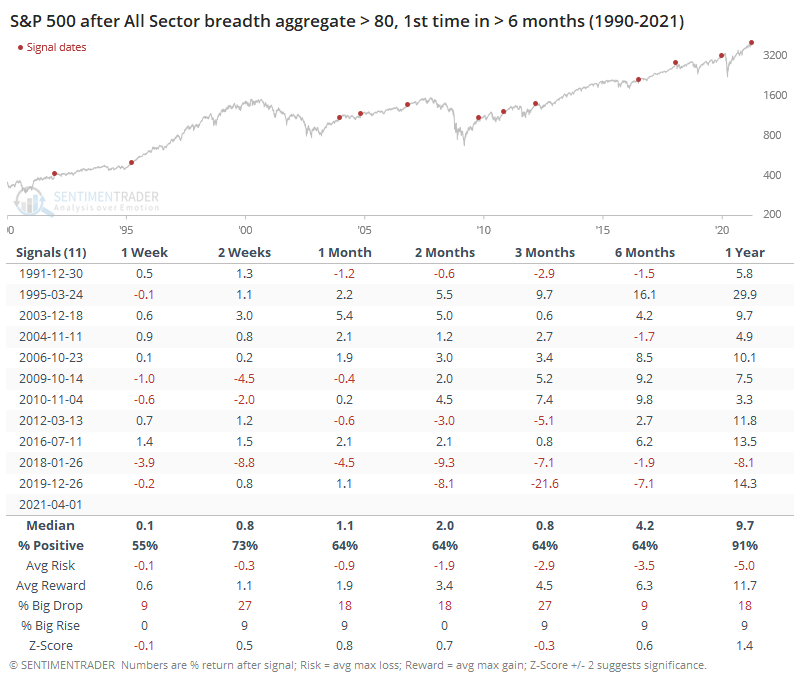
There were a couple more dates when this aggregate exceeded +80, and forward returns were good but only modestly above random.
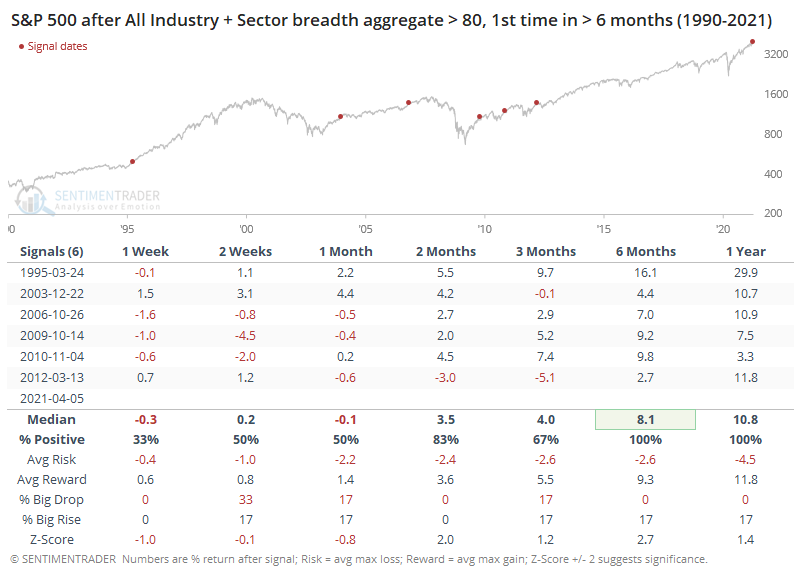
When we combine these signals, looking for times when both the All Industry and All Sector breadth aggregates exceeded +80, then we saw impressive returns going forward. The S&P showed no losses over the next 6-12 months, though again there was digestion in the near-term for 5 out of the 6 signals.
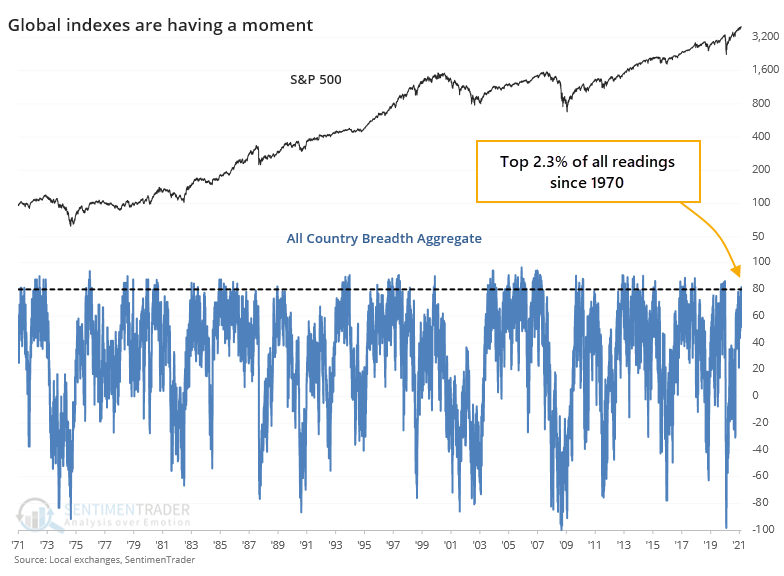
It's not just the U.S. that's participating. Among major global indexes, we're also seeing one of the most impressive thrusts in breadth, this time going back more than 50 years.
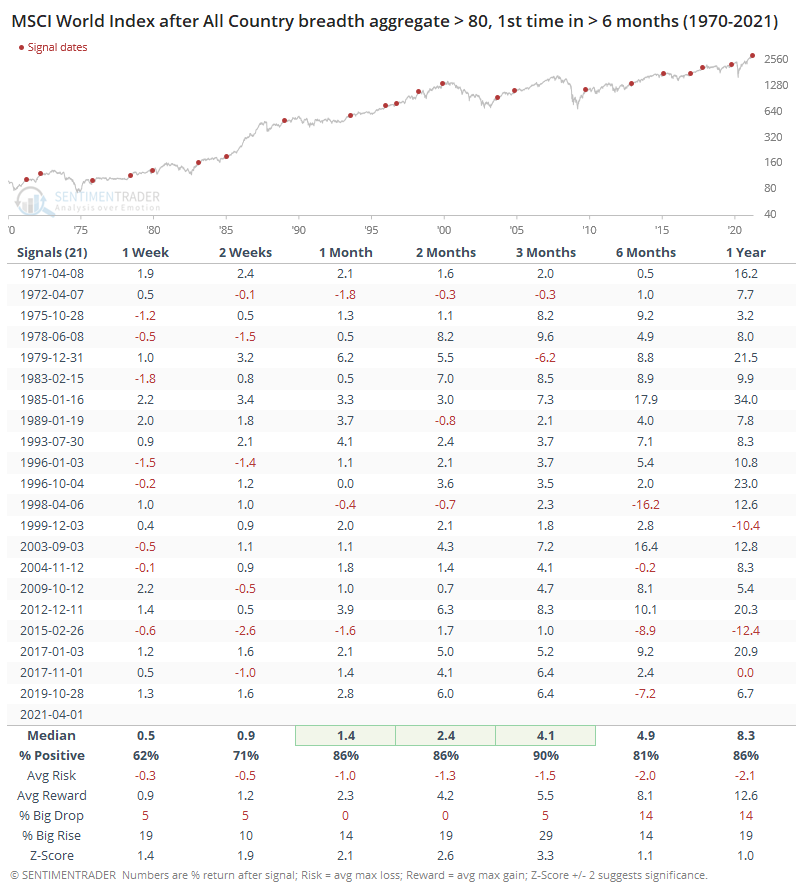
For the MSCI World Index, that preceded further gains over the next 1-3 months almost every time, and those rare losses were extremely small. It's hard to note anything negative about this at all, other than a few of them gave up the gains over the longer-term.
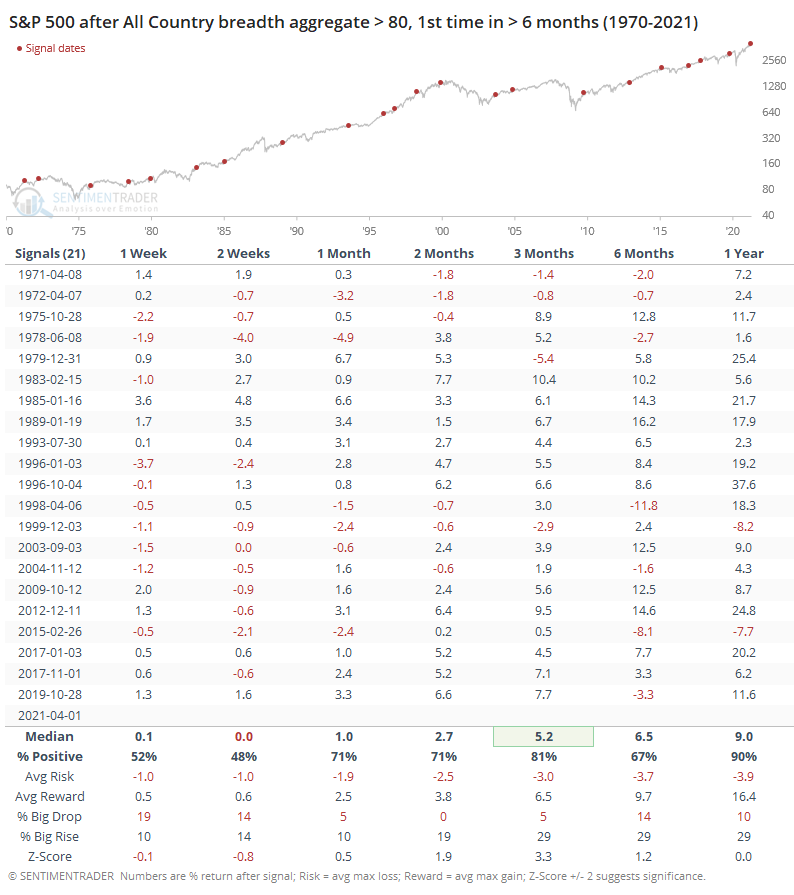
For the S&P 500, these periods of global health also led to mostly positive returns.
The biggest conundrum with our current environment is how quickly we went from one extreme (in March 2020) to the other. There hasn't really been another time in history when we've seen a recovery from a bear market like that, while also being at new all-time highs.
So, we're seeing a type of conflict that really hasn't happened before, at least not that we can find. Many of the measures related to thrusts, momentum, and breadth, are the types that only trigger during the first phase of a multi-year bear market recovery. But most of the sentiment-related measures have generated signals that typically only trigger near the ends of multi-year bull markets.
It's hard, maybe impossible, to reconcile these conflicts. So far, the positives have been winning, though there has been quite a bit of under-the-surface rotation. That hasn't been enough to manifest in broad-based deterioration that would trigger some of the warning signs we watch for after investors become overly optimistic. That means there isn't much of a change in the dynamic we've had to wrestle with for months now - impressive, even historic, breadth and momentum that's being met with some of the most optimistic investor behavior on record.
A typical market response to lesser conflicts has been choppy conditions in major indexes, with further gains eventually given back. That's been the outlook for a while and seems like it's continuing.