
A historic reversal, but...

Yesterday, we looked at times when SPY had gapped up and then reversed to close in the bottom part of its intraday range. It suggests buying exhaustion and it looks nasty on a chart, but was not an accurate warning of further losses.
We got some "yeah, but" questions noting that it only goes back to the early 1990s and only looked at the opening gap, not the intraday high. So, let's look at that.
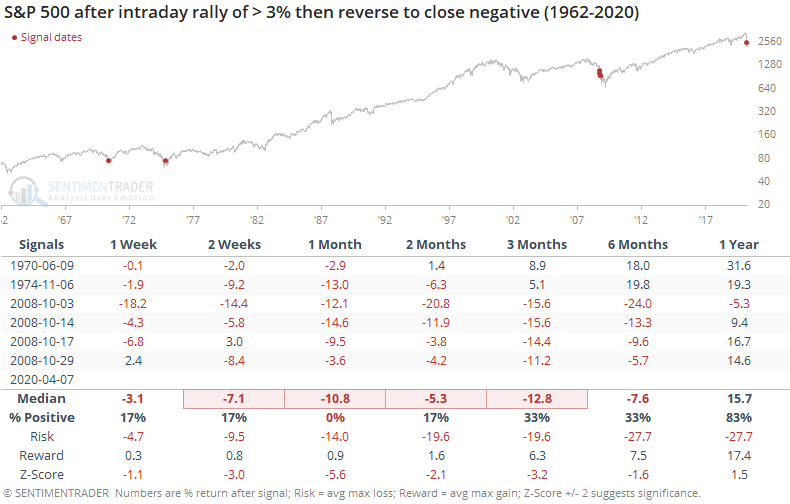
Tuesday's reversal was one of the worst since 1962, with a 3% intraday gain evaporating into the close. The precedents were not good, at least over the next month. Typically, stocks continued sliding immediately.
Since the sample size is so small, and dominated by one time period (October 2008), let's relax the parameters to a 2% intraday reversal.
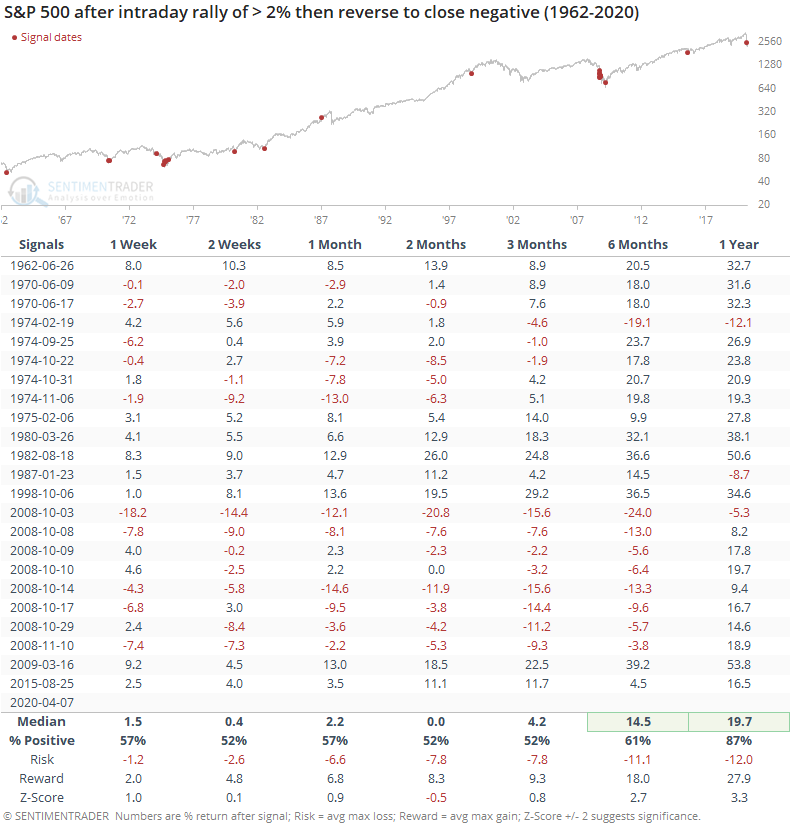
If a study is robust, then modestly changing the inputs shouldn't alter the conclusion too much. This one did, as stocks rallied over the next month most of the time. And when we exclude only one year, 2008, returns turn significantly positive.
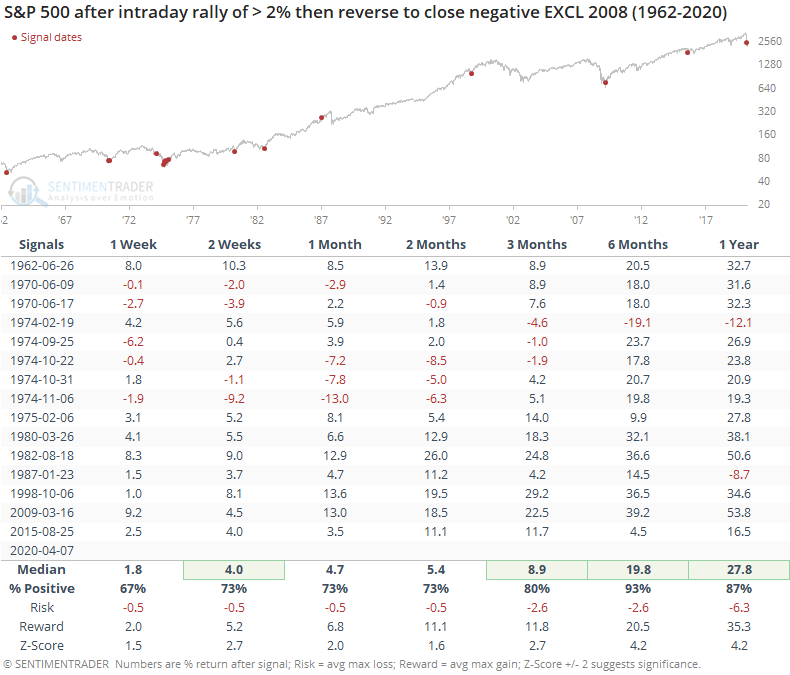
The reversal on Tuesday seems like a worry since it looks bad on a chart and a cursory review of the precedents were all ugly. Adjusting the parameters by only a modest amount alters the conclusion quite a lot, however, so we would not consider it a strong reason to expect weakness.