Products
SentimenTrader Trading Tools
‍
Backtest Engine
My Trading Toolkit
Correlation Analysis
Seasonality
Indicators & Data API
‍
Proprietary Indicators & Charts
Market Data API
Strategies & Scanner
‍
50+ Trading Strategies
Smart Stock Scanner
Research Reports
‍
Research Solutions
Reports Library
Free Resources
Simple Backtest Calculator
Simple Seasonality Calculator
The Kelly Criterion Calculator
Sentiment Geo Map
Public Research Reports
Pricing
Company
About
In the News
Testimonials
Client Success Stories
Contact
Log inLoginSign up
< BACK TO ALL REPORTS

A key reversal pushes trends to important junctures

Jason Goepfert
2021-02-02
The S&P 500 suffered a key reversal week last week, as it finally dropped below its 50-day moving average. Barely 40% of stocks within the index have held above their own averages, a threshold that has been an important level to watch.

It's been a couple of days since the dust settled on last week, and stocks managed to rebound strongly.

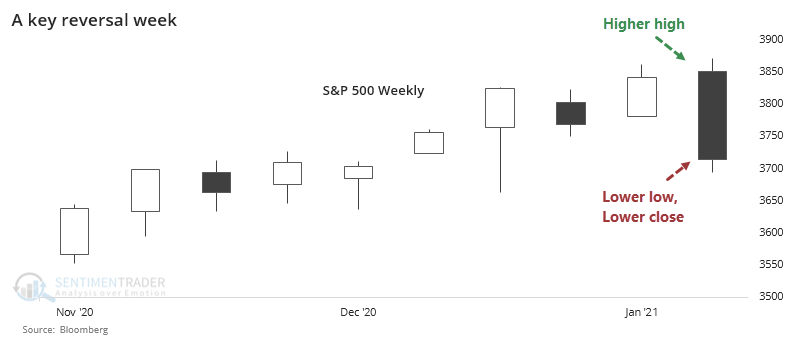
This is a little bit unusual since last week was a negative Key Reversal Week, with a higher high, but lower low and lower close.

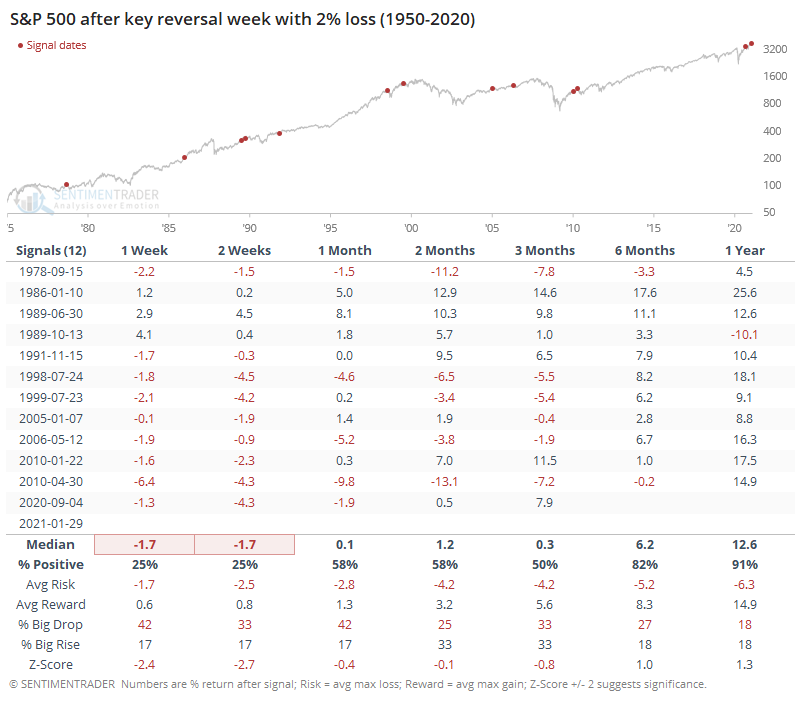
A week like that has had consistently negative overtones for the weeks ahead when the closing loss was more than 2% for the week.

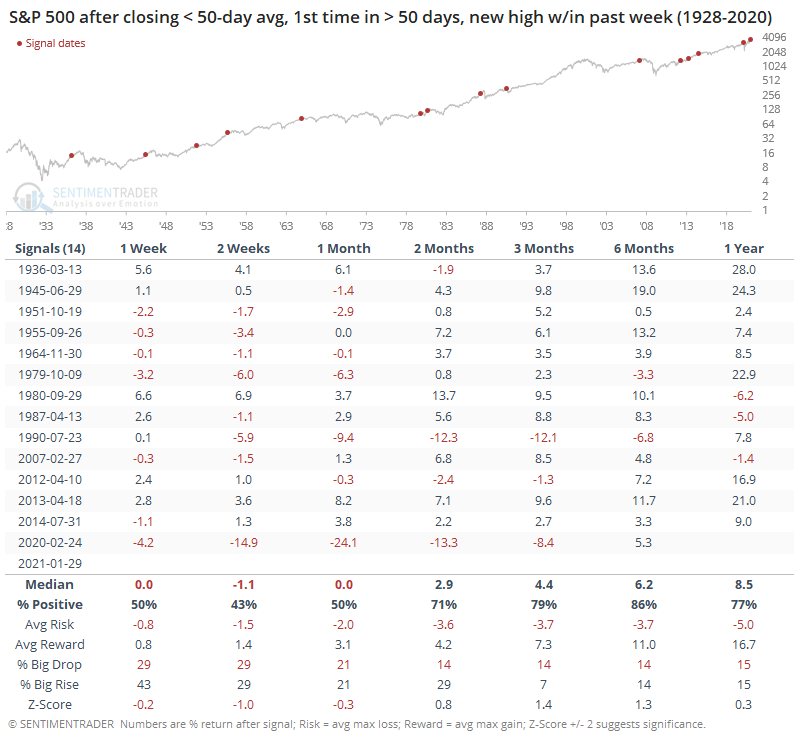
In the process, the S&P 500 lost its 50-day moving average. That's the first time it had been below its 50-day in more than 50 sessions, a relatively long streak when occurring after what had just been a 52-week high. Other times its medium-term trend shifted like this, the index struggled in the shorter-term but it was not a consistent longer-term sell signal.

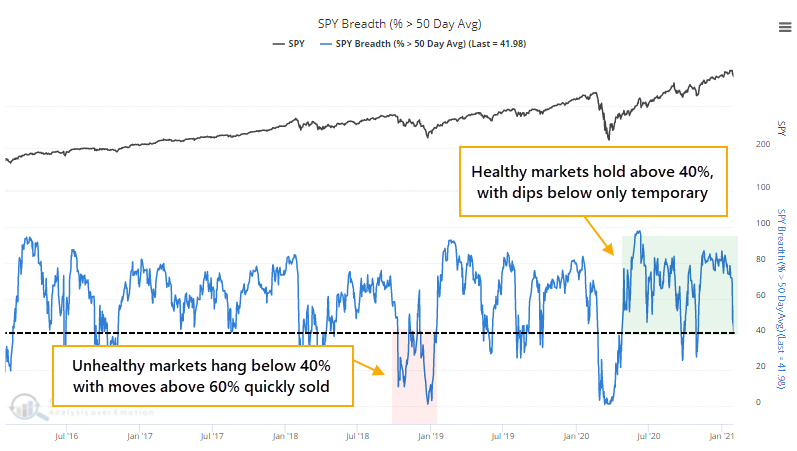
As we saw last week, there was a quick and substantial pullback in the percentage of stocks within the S&P that were above their own 50-day moving averages. That corrected further on Friday, and stopped right around the 40% level. In healthy market environments, this is about where it tends to stop as buyers tend to step in quickly and that's about it for the pullbacks. It appears the same thing happened this time, though it's still too early to tell.

During unhealthy environments, we consistently see fewer than 40% of stocks above their averages, and moves above 60% tend to bring sellers in quickly. So far, this still looks healthy.

The percentage of industries and sectors above their 50-day averages both plunged below 40%, so that bears watching. More than 40% of countries are still above their average, so that's a bit of a positive.

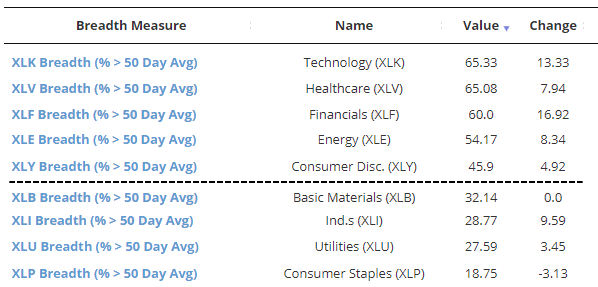
Among sectors, it's mostly the defensive ones that are seeing the fewest stocks above their 50-day averages, so there is still evidence of a risk-on mentality.

So far, there isn't much evidence that this is anything other than a pullback within a healthy environment. Some cracks are starting to show, and certainly the sentiment backdrop means the market is on shaky footing. But we need to see measures like this hold below key levels to have more confidence that there has been a true change in character.

Sorry, you don't have access to this report

Upgrade your subscription plan to get access
Go to Dasboard
PRODUCTS
SentimenTrader
Trading Tools
Indicators & Data API
‍
Strategies & Scanner
‍
Research Reports
FREE
RESOUrCES
Simple Backtest
Calculator
Simple Seasonality
Calculator
The Kelly Criterion
Calculator
Sentiment Geo Map
‍
Public Research Reports
‍
Pricing
Bundle pricing
‍
Announcements
‍
FAQ
COMPANY
‍
About
‍
In the News
‍
Testimonials
‍
Client Success Stories
CONTACT
‍
General Inquiries
‍
Media Inquiries
‍
Financial Professionals Inquiries
‍
© 2025 Sundial Capital Research Inc. All rights reserved.
Setsail Marketing
TermsPrivacyAffiliate Program
Risk Disclosure: Futures and forex trading contains substantial risk and is not for every investor. An investor could potentially lose all or more than the initial investment. Risk capital is money that can be lost without jeopardizing ones’ financial security or life style. Only risk capital should be used for trading and only those with sufficient risk capital should consider trading. Past performance is not necessarily indicative of future results.

Hypothetical Performance Disclosure: Hypothetical performance results have many inherent limitations, some of which are described below. No representation is being made that any account will or is likely to achieve profits or losses similar to those shown; in fact, there are frequently sharp differences between hypothetical performance results and the actual results subsequently achieved by any particular trading program. One of the limitations of hypothetical performance results is that they are generally prepared with the benefit of hindsight. In addition, hypothetical trading does not involve financial risk, and no hypothetical trading record can completely account for the impact of financial risk of actual trading. for example, the ability to withstand losses or to adhere to a particular trading program in spite of trading losses are material points which can also adversely affect actual trading results. There are numerous other factors related to the markets in general or to the implementation of any specific trading program which cannot be fully accounted for in the preparation of hypothetical performance results and all which can adversely affect trading results.

Testimonial Disclosure: Testimonials appearing on this website may not be representative of other clients or customers and is not a guarantee of future performance or success.