
A Long-Term Perspective on PPI Inflation - Part II

In this piece, I highlighted the history of the performance of the Dow Jones Industrial Average based on different levels of inflation, as calculated using the 12-month rate-of-change for the Producer Price Index.
This piece will create a simple model to highlight periods when inflation (or deflation) poses a risk to the stock market. Please note that we will not attempt to engage in any precision market timing. The focus will be entirely on avoiding the stock market when inflation risks are at their highest.
THE CALCULATIONS
PPI data for a given month is published during the following months. So, in August 2021, the PPI value for July was published. For our model, regardless of when the latest data is published within a given month, we will evaluate the latest results on the last day of the month and decide whether the model is favorable or unfavorable for the following month.
At the end of each month:
- Divide the current value for the Producer Price Index
- By the value from 12 months ago, to calculate the percentage change over the past 12 months
For example:
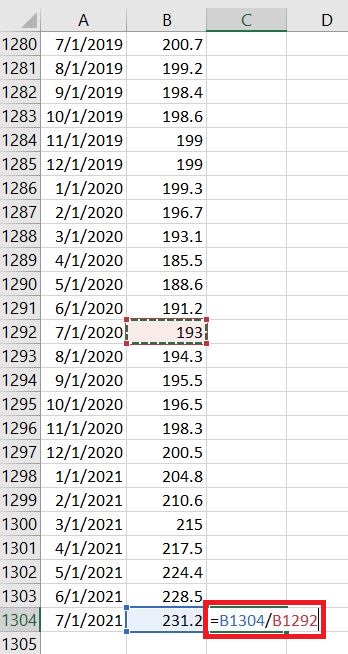
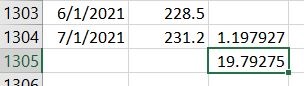
- On 8/12, the July 2021 PPI value was reported as 231.20
- The July 2020 PPI value was 193
- So, at the end of August 2021, the 12-month % change for PPI will be recorded as +19.79%
(NOTE: A step-by-step guide to the calculations appears at the end of this piece)
THE HISTORY
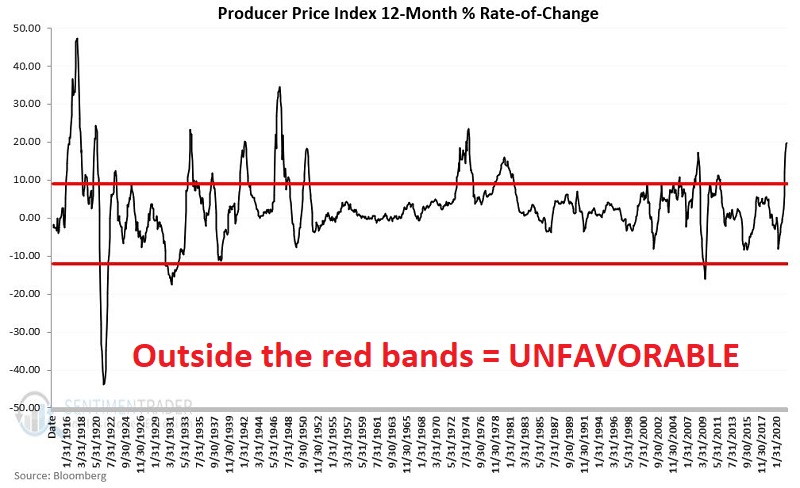
The chart below displays the results of the calculations above since 1914. As discussed below, the +9% level and the -12% level are also highlighted.
THE RULES
For evaluation and trading purposes, we will use the following rules:
- IF PPI 12-month Inflation (as calculated above) is greater than -12% AND less than 9%, HOLD STOCKS
- IF PPI 12-month Inflation (as calculated above) is less than or equal to -12% OR greater than or equal to 9% AVOID STOCKS
RESULTS WHEN MODEL IS FAVORABLE
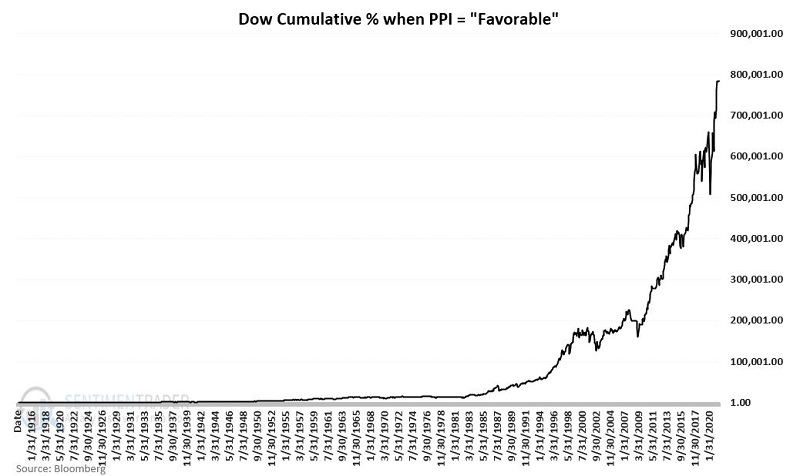
The chart below displays the cumulative % +(-) for the Dow since 1914 if held only when PPI inflation is above -12% AND below +9%, i.e., when conditions are "favorable." The cumulative result is a gain of +783,668%.
RESULTS WHEN MODEL IS UNFAVORABLE
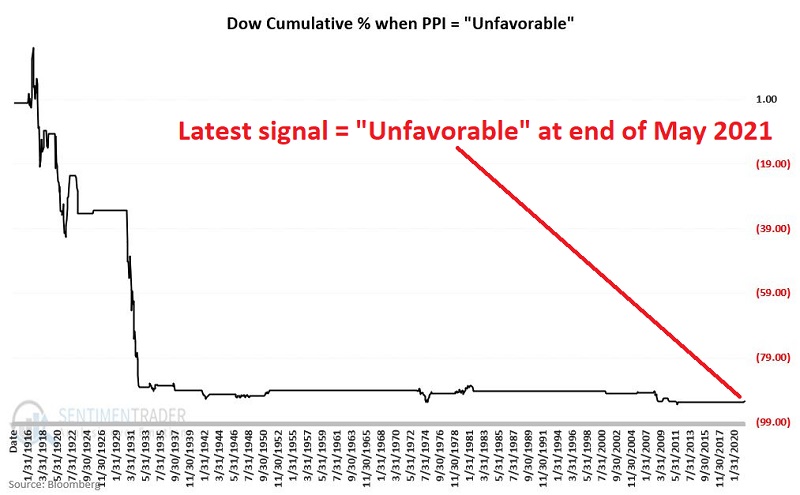
The chart below displays the cumulative % +(-) for the Dow since 1914 if held only when PPI inflation is EITHER less than or equal to -12% OR greater than or equal to +9%. The cumulative result is a loss of -92.5%.
COMBINED RESULTS
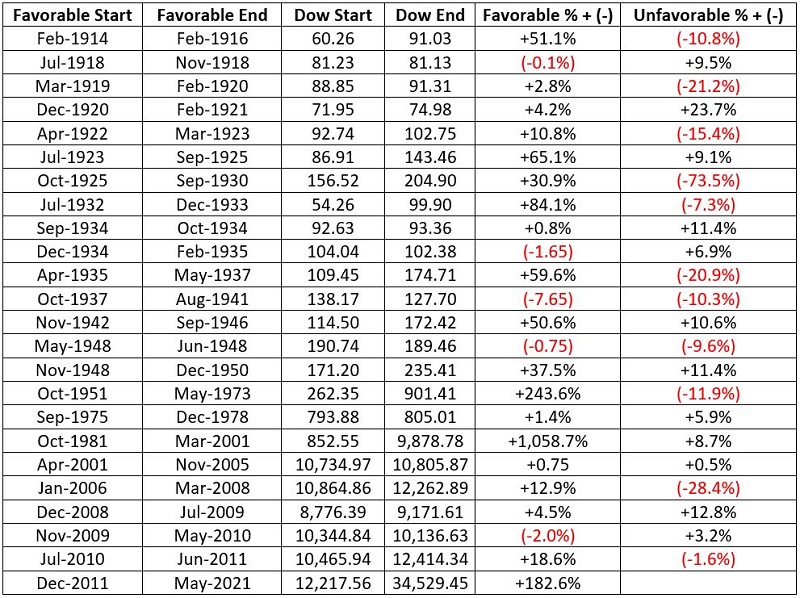
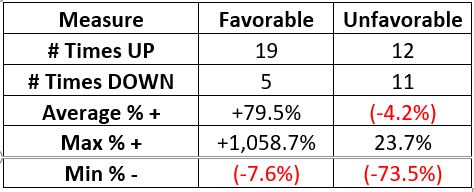
The table below displays the hypothetical % price gain or loss for the Dow Jones Industrial Average during all "Favorable" and Unfavorable" periods.
Please note that:
- The latest signal shifted to "unfavorable" territory at the end of May 2021, when PPI inflation first rose above +9%
- So far, the stock market has ignored this unfavorable warning completely and has marched relentlessly to new highs
A summary of previous signals appears in the table below.
SUMMARY
Investors hoping to pick "tops and bottoms" will have to look elsewhere than this simple model. However, this model may have value for investors who want to keep track of when inflation (or deflation) is most likely to cause problems for stocks.
Step-by-Step Guide for Calculations
At or near the end of each month:
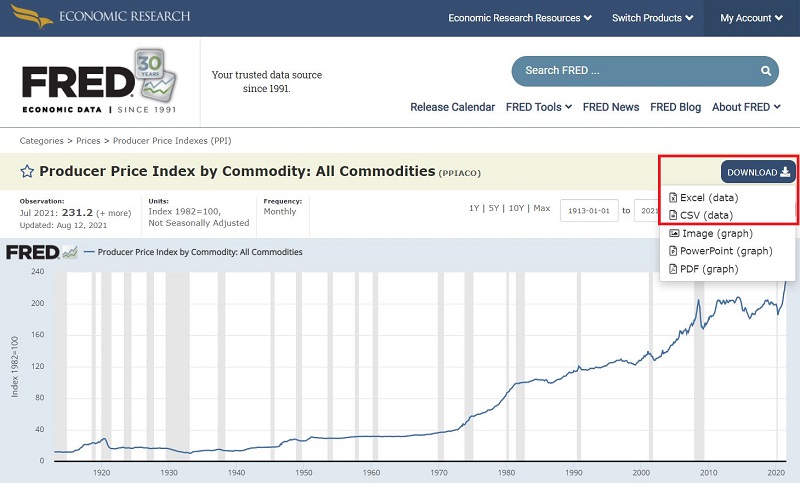
- Go to this link
- Click "DOWNLOAD," then select either "Excel" or "CSV"
- Open the downloaded file
- Divide the latest value by the value 12 months ago
- From the resulting value, subtract 1, then multiply by 100
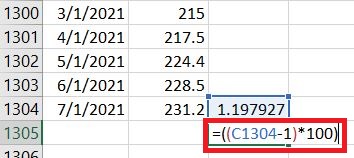
- This shows the 12-month percentage change in the PPI index value itself
IMPORTANT:
- Note that the date that appears is the first day for the actual month of data (i.e., "7/1/2021" means this is the index value for July 2021
- HOWEVER, for this model, the value calculated above gets assessed at the end of the following month
So, for the data in the file listed "7/1/2021", then:
- The calculated 12-month percent change value gets assessed on 8/31/2021
The resulting designation of "Favorable" (if the calculated value is >=-12 AND <= 4) or "Unfavorable" (if the calculated value is < -12 OR > 4) applies to September 2021