
A margin debt "what if"

For years, investors were worried about the growth in margin debt. As stocks rose throughout 2015, and kept going, there was a chorus of calls that investors were too optimistic.
Empirical evidence didn't support those concerns. The rate of growth in debt wasn't anywhere near prior extremes, especially when compared against the growth in stocks. For the most part, it was controlled and reasonable.
That has started to change in recent months. Based on how stocks have performed in March, and the historical relationship to margin debt, we can reasonably expect the next release to show eye-popping numbers.
Over the past 90 years, there has been a positive correlation between the S&P 500's performance during a month and the change in margin debt. As stocks rise, investors become more comfortable and borrow more against their appreciated holdings.
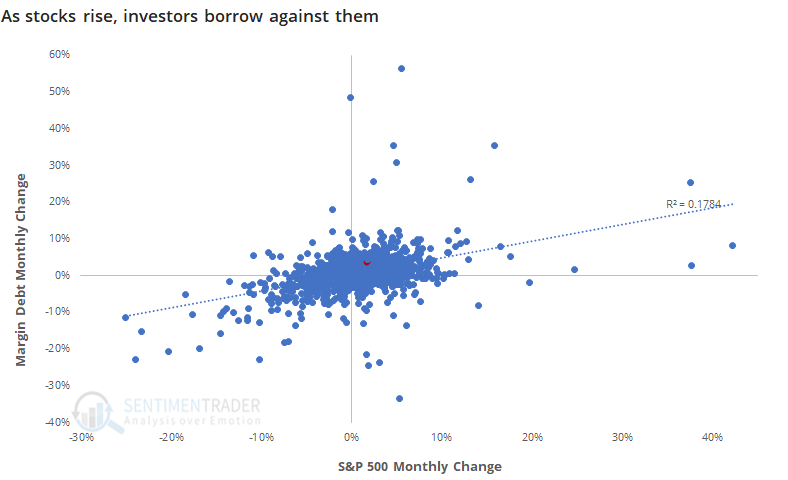
Based on this historical relationship, and how stocks have done so far this month, we can reasonably expect debt to exceed $831 billion when March's numbers are reported in April. Granted, that's assuming that stocks don't completely crater in the next 2 weeks.
Using some conservative assumptions, the below chart shows what the year-over-year rate of change in margin debt should look like when the next round of numbers are reported.
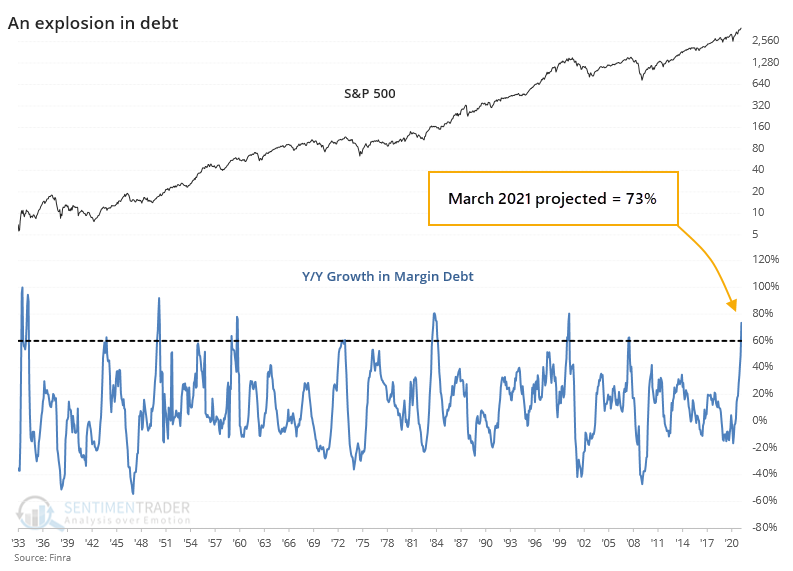
We can expect borrowings against stocks to appreciate more than 70% over where it was a year ago. Even if it only rises 60% from last March, it will still mark one of the sharpest expansions in debt since 1931.
Investors can be excused for holding more debt against stocks that have appreciated. The worry is that they've become increasingly comfortable even when accounting for the growth in stocks.
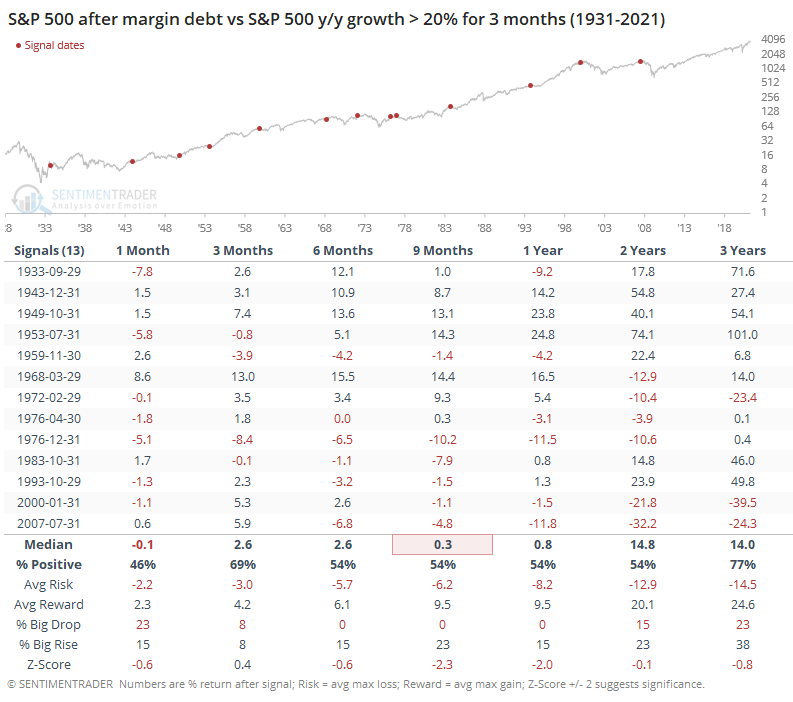
If current estimates hold, then the year-over-year change in debt will have exceeded the year-over-year change in the S&P 500 by more than 20% for 3 months running.
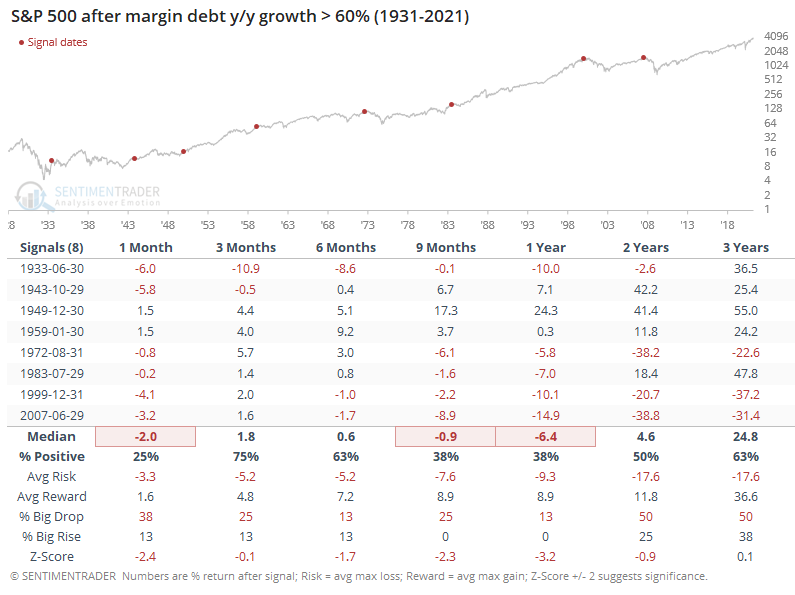
Particularly in recent decades, this kind of excessive and persistent growth in debt, on both an absolute and relative level, has been a boogeyman for forward returns. The last 9 instances, dating back to the 1950s, have all shown a negative return somewhere between the next 9-24 months.
Debt is still not near an extreme relative to the overall market cap of U.S. equities, but we've seen in the past that this is not a very effective indicator. The most effective use of the data, both on the upside and downside, has been the rate of change, including relative to the S&P. And that's why it's becoming to be a much larger concern.