
A mixed market message continues

Key points:
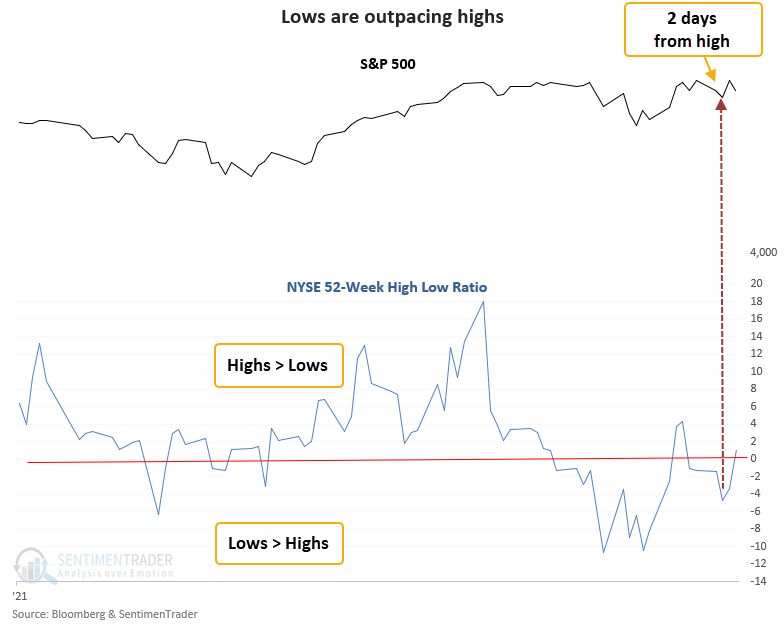
- NYSE lows outpaced highs by a ratio of 4.76 on Tuesday
- At the same time, the S&P 500 was <= 2 days from a 252-day high
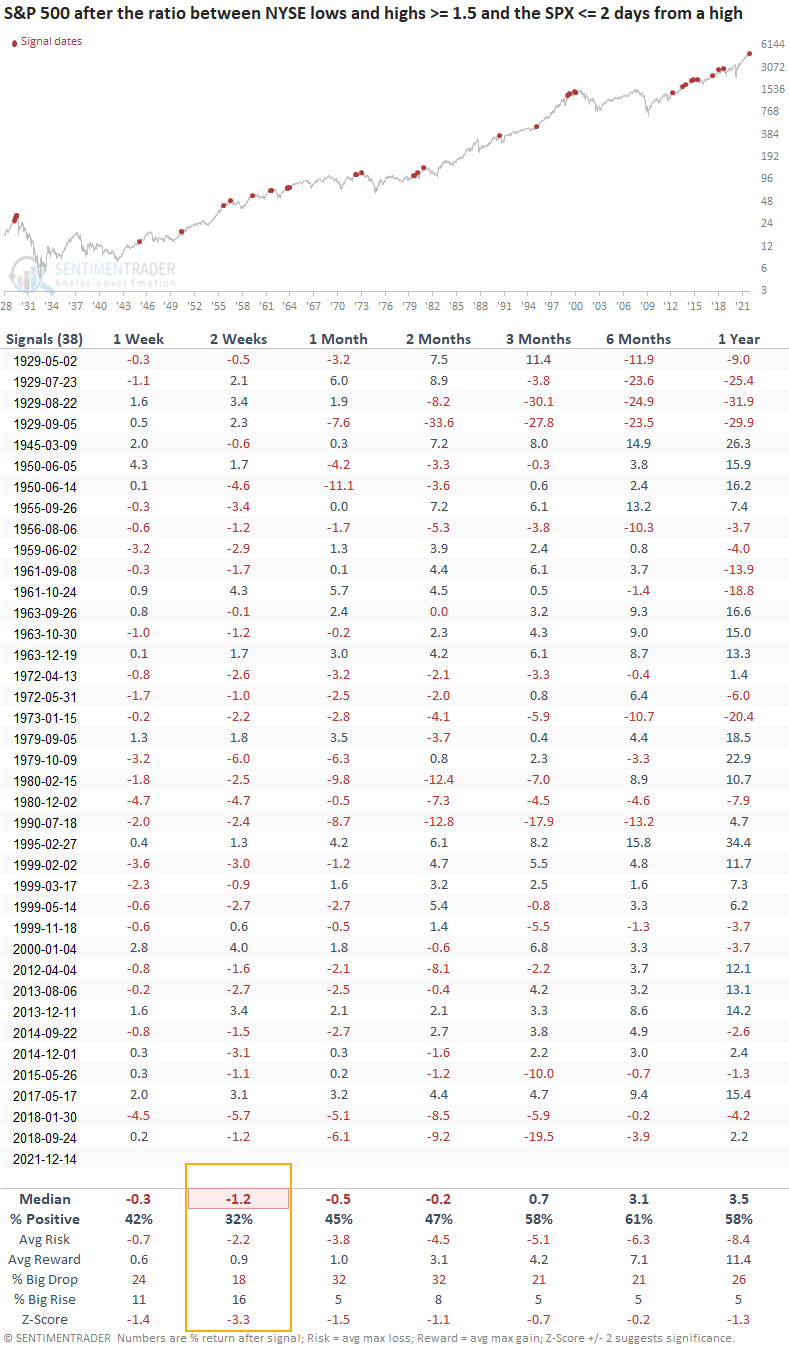
- Similar conditions preceded negative returns from 2-8 weeks later
NYSE lows are outpacing highs, triggering a new risk warning model alert
A new signal from a voting member in the TCTM Risk Warning Model registered an alert on Tuesday. The component is called the New 52-Week High Low Ratio model.
The new 52-week high low ratio model identifies when NYSE 52-week lows exceed 52-week highs by a ratio of 1.5 or greater. At the same time, the S&P 500 index is two days or less from a 252-day high.
Please click here for the TCTM live updates page on the website.
The market breadth backdrop continues to show a mixed message
Similar signals preceded weak returns in the near term
This signal triggered 38 other times over the past 93 years. After the others, future returns and win rates were weak in the 2-8 week time frame. The z-score in the 2-week time frame looks troubling.
What the research tells us...
When the ratio between NYSE lows and highs is dominated by lows and the S&P 500 is 2 days or less from a 252-day high, the market risk outweighs the reward. Similar setups to what we're seeing now have preceded weak returns and win rates in the 2-8 week time frame.
Something to keep in mind
- While several TCTM Risk Warning Model components have issued an alert highlighting an unhealthy breadth environment, I would keep the following in mind. Financials are not dominating the new lows list. That's an important distinction from other periods when the risk warning model issued alerts. Financials are the most systemically important group to monitor. If the financials are out of sync with the broad market, we need to be more attentive to potential unforeseen risks.
- We continue to see a mixed message from breadth-based indicators. However, the economic backdrop, credit conditions, and primary trend of the S&P 500 look fine. So, it's conceivable that the S&P 500 continues to consolidate in a range, with conflicting messages in both directions.