Products
SentimenTrader Trading Tools
‍
Backtest Engine
My Trading Toolkit
Correlation Analysis
Seasonality
Indicators & Data API
‍
Proprietary Indicators & Charts
Market Data API
Strategies & Scanner
‍
50+ Trading Strategies
Smart Stock Scanner
Research Reports
‍
Research Solutions
Reports Library
Free Resources
Simple Backtest Calculator
Simple Seasonality Calculator
The Kelly Criterion Calculator
Sentiment Geo Map
Public Research Reports
Pricing
Company
About
In the News
Testimonials
Client Success Stories
Contact
Log inLoginSign up
< BACK TO ALL REPORTS

A month after initial surge, energy stocks show record gain

Jason Goepfert
2020-04-27
In late March, there was a surge in the energy sector. More than 95% of stocks in the sector climbed above their 10-day moving averages, while fewer than 20% of them were above their long-term 200-day averages. In the month since then, the sector climbed another 13%, the best post-surge reaction in 30 years.

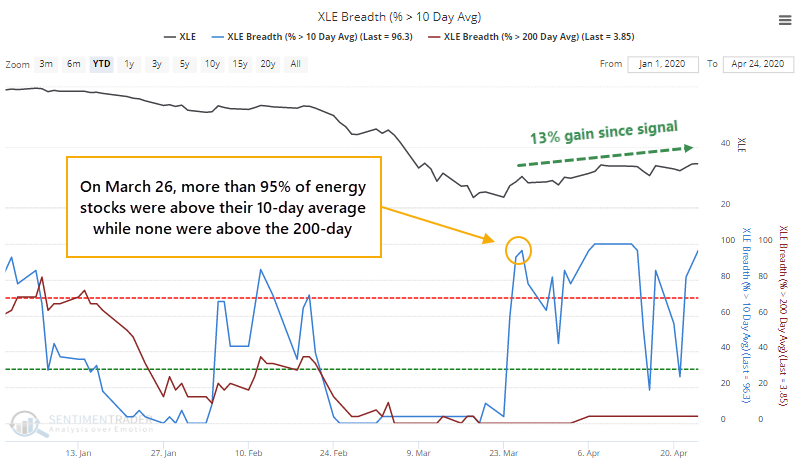
On March 26, there was enough of a surge in energy stocks that more than 95% of the ones in the S&P 500 Energy sector managed to close above their 10-day moving averages. But because of the longer-term devastation, none of them had yet managed to climb above their long-term 200-day averages.

That has signaled "dead cat bounce" more often than not in the past. Not this time - the sector climbed more than 13% in the 20 days since then and the percentage of stocks above their short-term averages popped above 95% again on Friday.

This 13% gain in the month following the initial surge is the best we've ever seen after a surge like that. Once we get to the one-month point following a jump like this, the risk/reward turned quite negative.

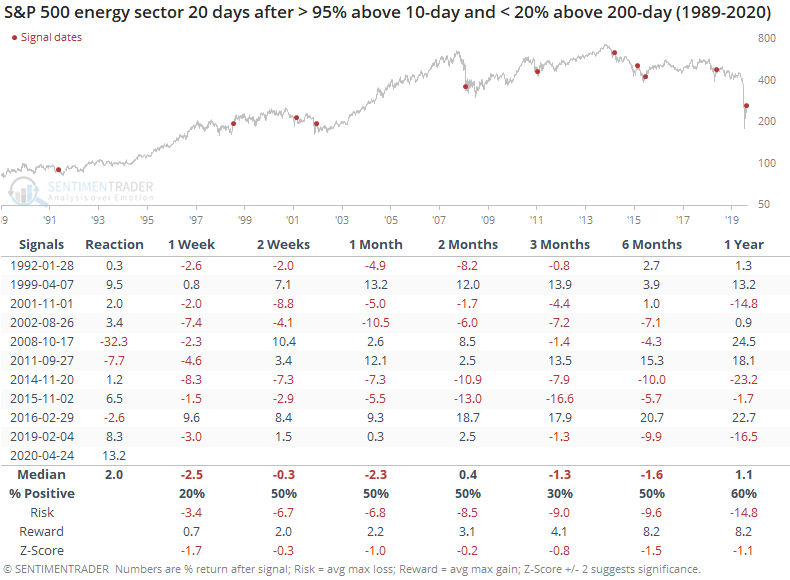
In the "Reaction" column, we see the return in the sector in the month following the initial surge (when more than 95% of stocks in the sector traded above their 10-day averages while fewer than 20% were above their 200-day averages). The current one, at 13.2%, is by far the best out of any of them.

If we filter the table to only include the best reactions, then we get the following.

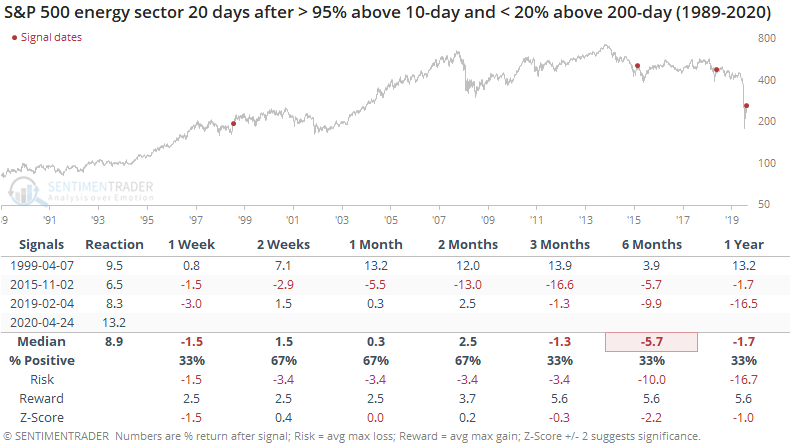
In 1999, energy stocks continued to soar over the next few weeks, then went nowhere, eventually giving back all the gains and then some as the broad market suffered from the dotcom collapse. 

The last two signals both peaked almost immediately or at least enjoyed only relatively small upside in the weeks and months ahead.

If we expand the sample to include any gain of more than 1% in the month following the initial surge, then the returns were quite poor.

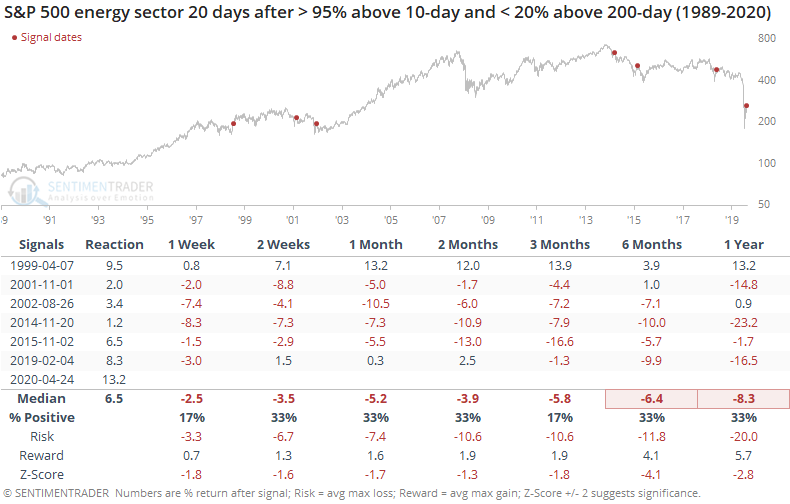
After these, the only gainer continued to be that signal from April 1999. All the others showed losses even up to three months later.

We've seen a lot of unprecedented action over the past month, especially in energy stocks. That might mean we can't rely as much on historical behavior. From what we can see, though, the upside has been limited at best when the sector showed a gain a month following its initial surge in poor markets.

Sorry, you don't have access to this report

Upgrade your subscription plan to get access
Go to Dasboard
PRODUCTS
SentimenTrader
Trading Tools
Indicators & Data API
‍
Strategies & Scanner
‍
Research Reports
FREE
RESOUrCES
Simple Backtest
Calculator
Simple Seasonality
Calculator
The Kelly Criterion
Calculator
Sentiment Geo Map
‍
Public Research Reports
‍
Pricing
Bundle pricing
‍
Announcements
‍
FAQ
COMPANY
‍
About
‍
In the News
‍
Testimonials
‍
Client Success Stories
CONTACT
‍
General Inquiries
‍
Media Inquiries
‍
Financial Professionals Inquiries
‍
© 2025 Sundial Capital Research Inc. All rights reserved.
Setsail Marketing
TermsPrivacyAffiliate Program
Risk Disclosure: Futures and forex trading contains substantial risk and is not for every investor. An investor could potentially lose all or more than the initial investment. Risk capital is money that can be lost without jeopardizing ones’ financial security or life style. Only risk capital should be used for trading and only those with sufficient risk capital should consider trading. Past performance is not necessarily indicative of future results.

Hypothetical Performance Disclosure: Hypothetical performance results have many inherent limitations, some of which are described below. No representation is being made that any account will or is likely to achieve profits or losses similar to those shown; in fact, there are frequently sharp differences between hypothetical performance results and the actual results subsequently achieved by any particular trading program. One of the limitations of hypothetical performance results is that they are generally prepared with the benefit of hindsight. In addition, hypothetical trading does not involve financial risk, and no hypothetical trading record can completely account for the impact of financial risk of actual trading. for example, the ability to withstand losses or to adhere to a particular trading program in spite of trading losses are material points which can also adversely affect actual trading results. There are numerous other factors related to the markets in general or to the implementation of any specific trading program which cannot be fully accounted for in the preparation of hypothetical performance results and all which can adversely affect trading results.

Testimonial Disclosure: Testimonials appearing on this website may not be representative of other clients or customers and is not a guarantee of future performance or success.