
A new breadth thrust signal suggests higher stock prices

Key points:
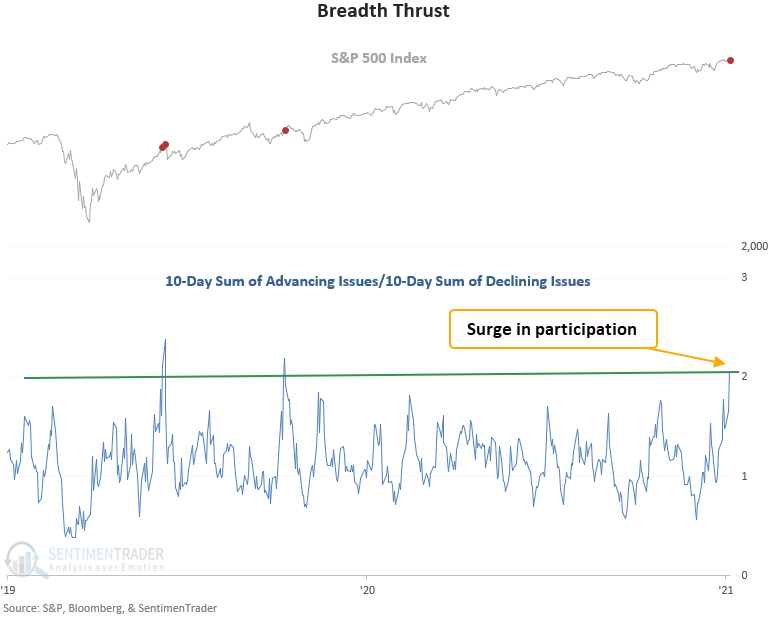
- A ratio between S&P 500 advancing and declining issues surged higher
- The burst in participation triggered a new breadth thrust buy signal on Tuesday
- The S&P 500 has rallied 84% of the time over the next 6 & 12 months after other signals
Advancing issues are outpacing declining issues, triggering a new composite thrust model alert
A new signal from a voting member in the composite thrust model registered an alert on Tuesday.
The breadth thrust system identifies when the 10-day sum of S&P 500 advancing issues exceeds the 10-day sum of S&P 500 declining issues by a ratio of 2.02 to 1. I use a reset condition to screen out repeats, which requires the ratio to fall below 0.8 before a new signal can trigger again.
Please click here for the TCTM live updates page on the website.
The S&P 500 shows significant z-scores in 6 out of 7 periods
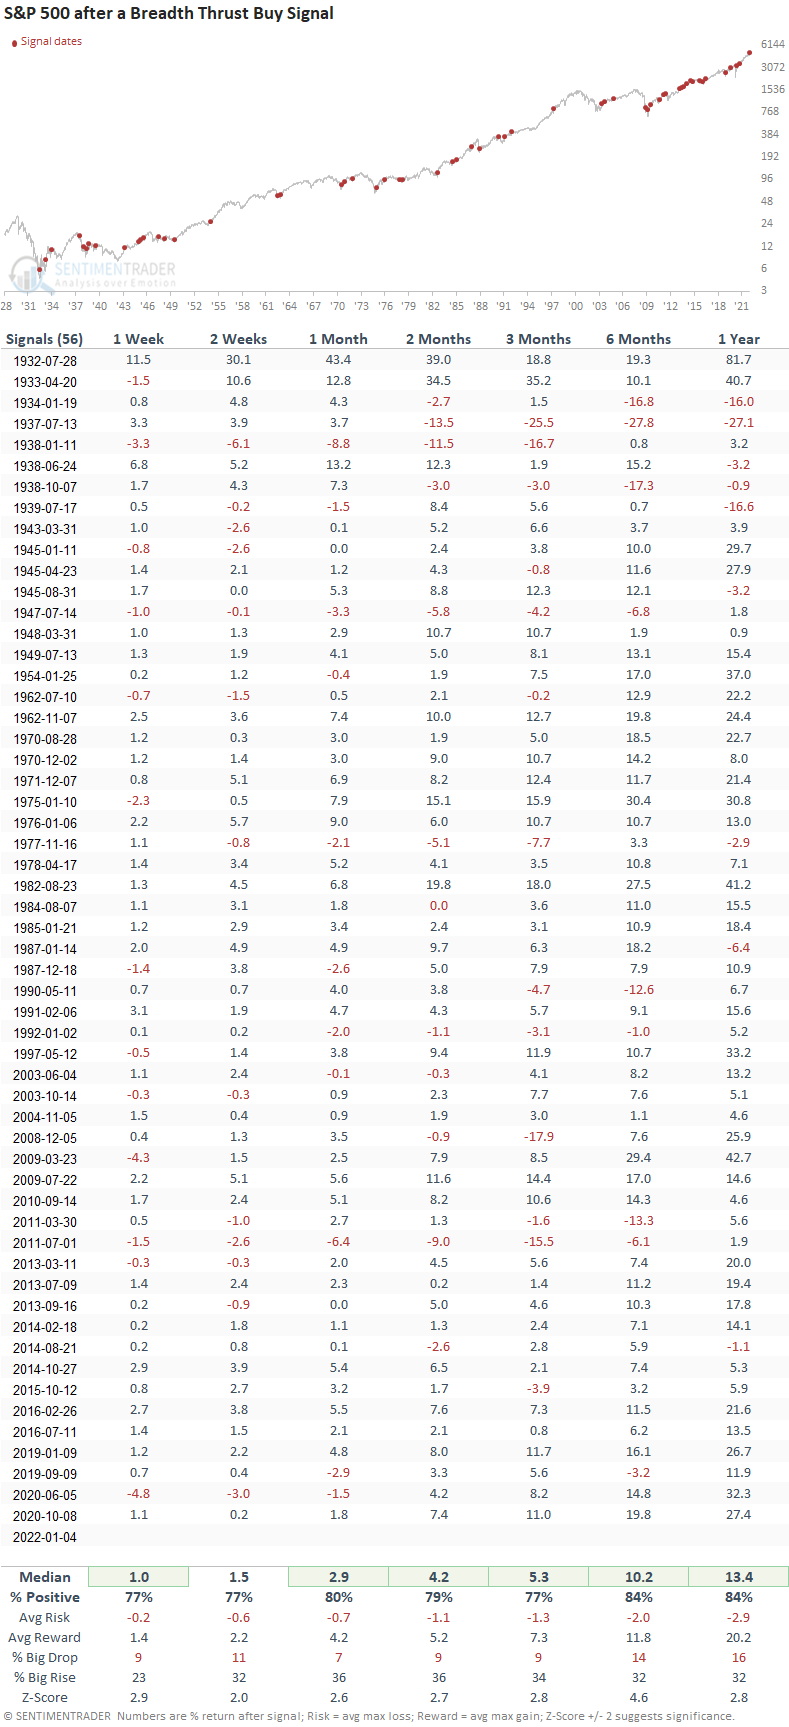
This signal has triggered 56 other times over the past 90 years. After the others, future returns, win rates, and risk/reward profiles were solid across all time frames. Since 1942, the win rate in the 12-month time frame has been excellent, with 44 out of 48 winners. And, the max drawdown was minimal, with a decline of 6.4%.
Signals associated with a market correction
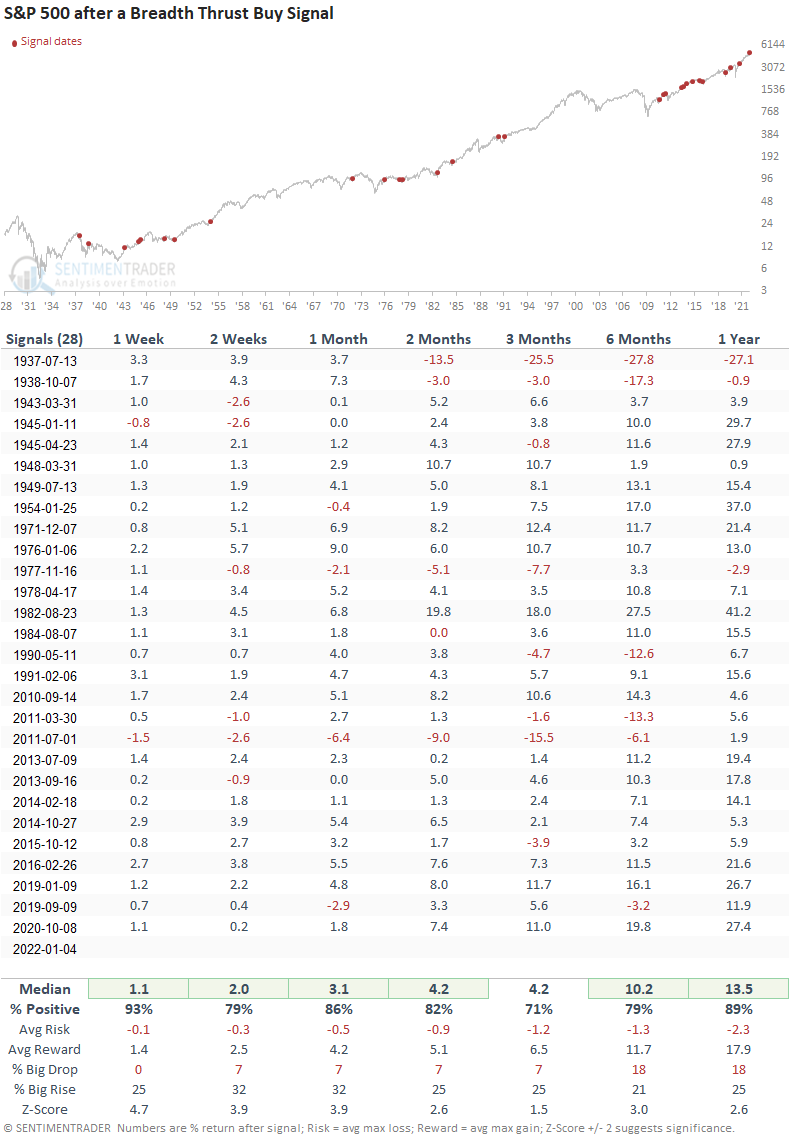
This signal triggered 28 other times over the past 85 years. After the others, future returns, win rates, and risk/reward profiles were excellent across all time frames, especially the 1-week window. When the S&P 500 undergoes a correction of 10% or less, the surge in participation provides a renewed energy source for the uptrend.
Signals associated with a new high
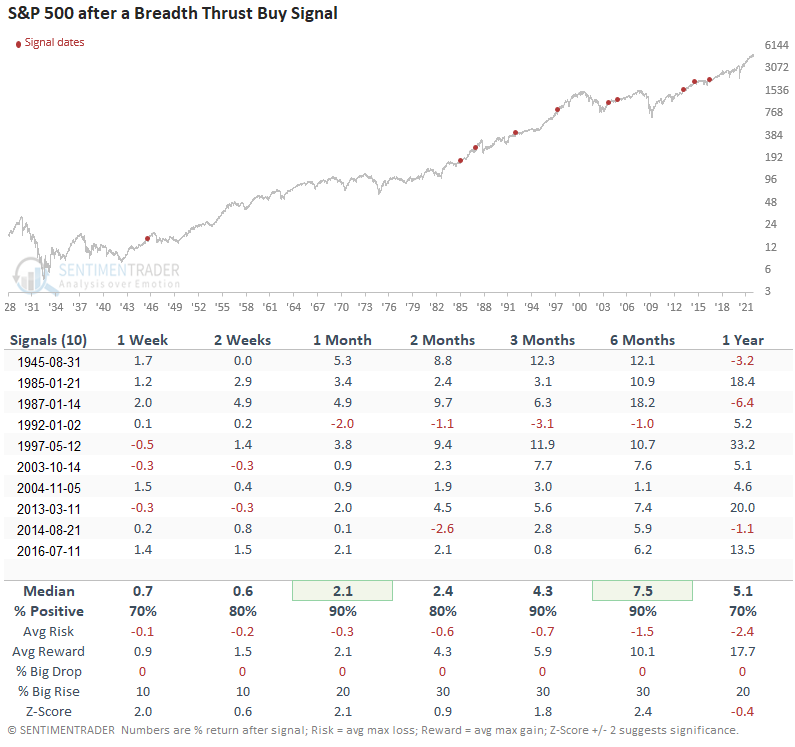
The new signal on 1/4/22 occurred after a shallow correction and when the S&P 500 was only 0.06% below its high. Given that context, let's review breadth thrust signals that happened when the S&P 500 simultaneously closed at a new 252-day high to assess the efficacy of the signal with somewhat similar conditions.
This signal triggered 10 times over the past 77 years. After the others, future returns and win rates were solid across all time frames, especially in the 6-month window. The worst drawdown across all time frames was 6.4%, which occurred in the 1-year window.
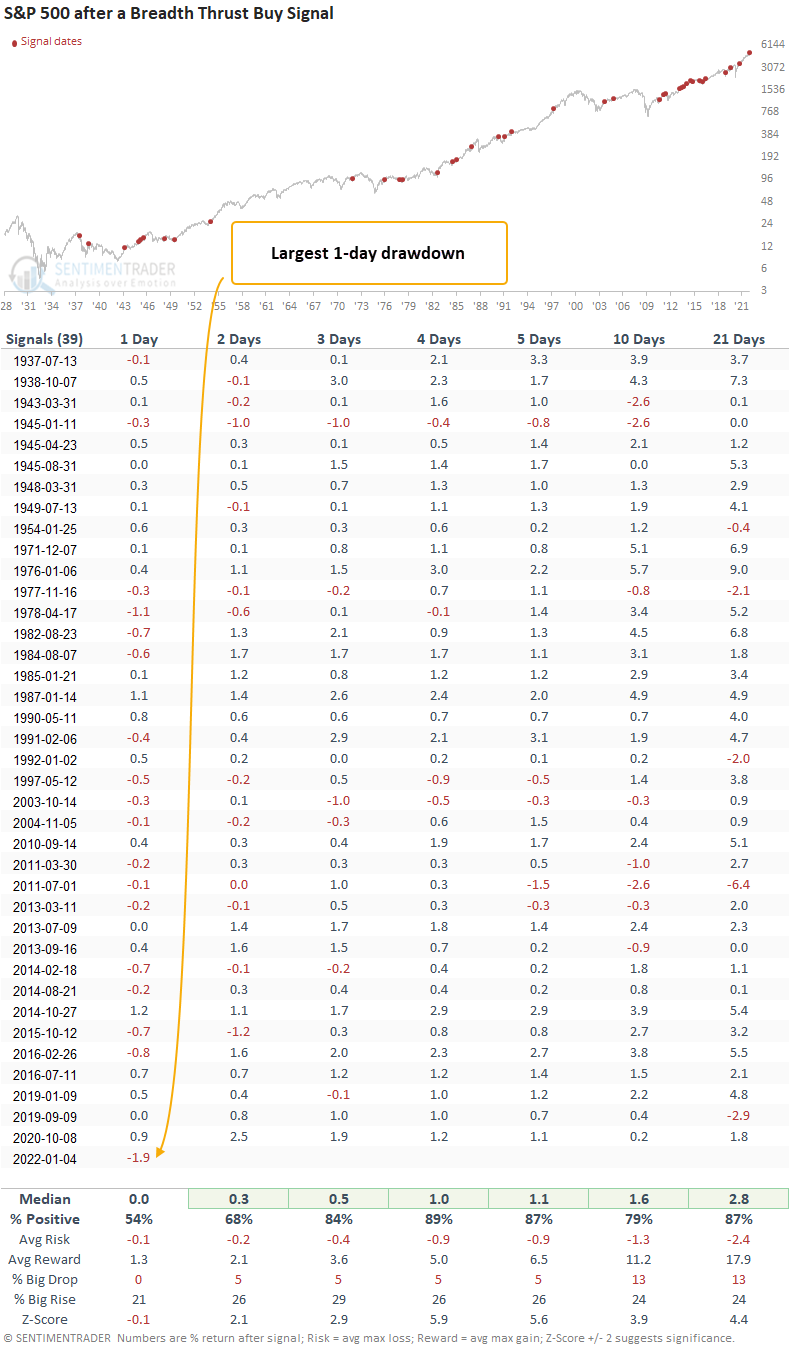
Signals associated with corrections and a new high - short term stats
Suppose we review signals that occurred within the context of a correction or at a new high using ultra-short time frames. In that case, we see that the 1-day return after the signal on 1/4/22 was the worst in history. Thank you, Fed minutes. Anything can happen in the short term as the day-to-day noise in the market is mind-numbing. Remember, trust the thrust.
What the research tells us...
When the ratio between advancing and declining issues surges in favor of advancing issues, the burst in participation provides a new energy source for the market. Similar setups to what we're seeing now have preceded rising S&P 500 prices across every time frame, with notable long-term results.