A New High but with Negative Breadth

Since the peak of the speculative orgy in February, we've been watching for major internal deterioration in the indexes. There were short bursts of unusual behavior in the months following that peak, but stocks immediately recovered.
There were more pronounced divergences during June and July, such as with the percentage of stocks holding above their 50-day moving averages. And with subsequent push to new highs, sentiment was becoming less and less enthused. Knee-jerk contrarians may take that as a positive thing, but stocks need buyers to be ever more optimistic to sustain an advance.
Investor confidence isn't necessarily the most influenced by movements in the S&P or Dow Industrials. While they get the headlines, investors are more concerned with broader movements in stocks.
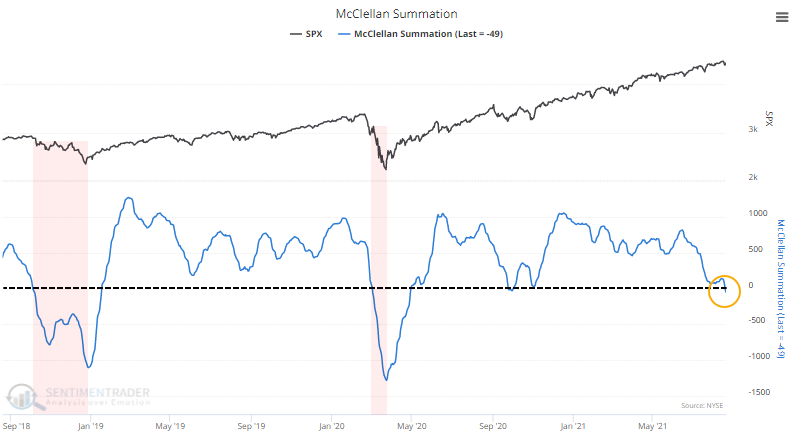
Two of our core measures for a long-term, broad look at how healthy stocks are is the NYSE McClellan Summation Index and the Net % of New Highs - New Lows. And right now, they're signaling caution.
Despite the S&P being near its prior high, the Summation Index is negative. The worst possible combination for this indicator is when it is below zero and declining. That's when the worst selloffs happen. There was a brief fakeout last September-October, but the current reading is already below that one.
On the NYSE, there are also now more securities falling to 52-week lows than rising to 52-week highs. When this is below zero, the S&P's annualized return is only about a third of what it is when it's above zero.
Out of all the times these indicators were below zero when the S&P was near a high, stocks suffered every time but once. There is a bit of boy-who-cried-wolf with this type of analysis because it hasn't worked at all in 2021. This time, the potential difference is that it's really the first time such broad and long-term metrics were so poor despite the major indexes holding near their highs.

What else we're looking at
- Future returns in the S&P 500 when it's near a high with a negative Summation Index and Net % New Highs
- An update on absolute and relative trends in industry, sector, and country ETFs
- Annualized returns in Asia Pacific indexes when they badly lag the U.S.
- What it means when energy stocks are highly correlated
| Stat box With 49 all-time highs so far this year, the S&P 500 is creeping towards its best year in history, knocking on the door of 1964 and 1995 as the two prior years with more all-time highs this early in a calendar year. |
Etcetera
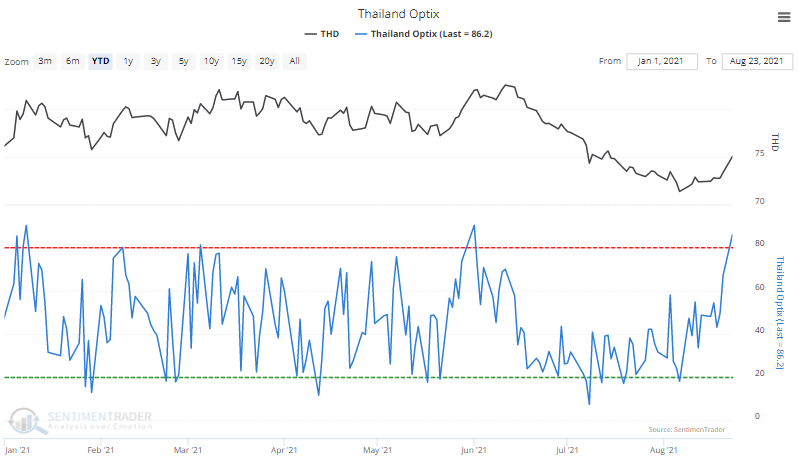
Thailand is tops. The Optimism Index for the THD Thailand fund is the highest among all funds we monitor. This is only the 3rd time it's been above 85 so far this year.
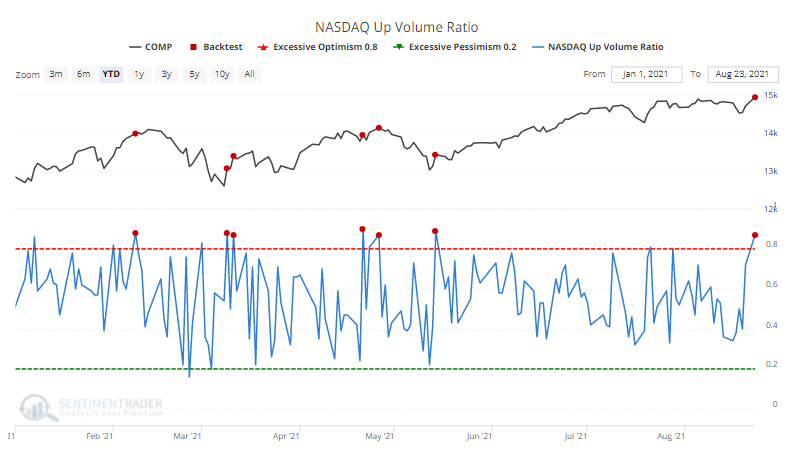
Nasdaq buying. For only the 7th time this year, more than 87% of volume on the Nasdaq exchange flowed into advancing stocks. Our Backtest Engine shows that the Composite showed a median return of -2.9% two weeks later.