Products
SentimenTrader Trading Tools
‍
Backtest Engine
My Trading Toolkit
Correlation Analysis
Seasonality
Indicators & Data API
‍
Proprietary Indicators & Charts
Market Data API
Strategies & Scanner
‍
50+ Trading Strategies
Smart Stock Scanner
Research Reports
‍
Research Solutions
Reports Library
Free Resources
Simple Backtest Calculator
Simple Seasonality Calculator
The Kelly Criterion Calculator
Sentiment Geo Map
Public Research Reports
Education
Sentiment Indicators
Technical Indicators
Pricing
Company
About
In the News
Testimonials
Client Success Stories
Contact
Log inLoginSign up
< BACK TO ALL REPORTS

A new high on weaker participation

Jason Goepfert
2021-02-05
The S&P 500 moved to a new high, but few members in the index also did. Relatively few are even above their 50-day moving averages. This comes amid a surge in penny stock trading, and a very low Equity Risk Premium.

Dean and I have been semi-obsessively checking for signs of internal deterioration for over a month. Following a speculative extreme like we've seen since November, internal divergences are usually an excellent heads-up that the excesses are on the cusp of being unwound.

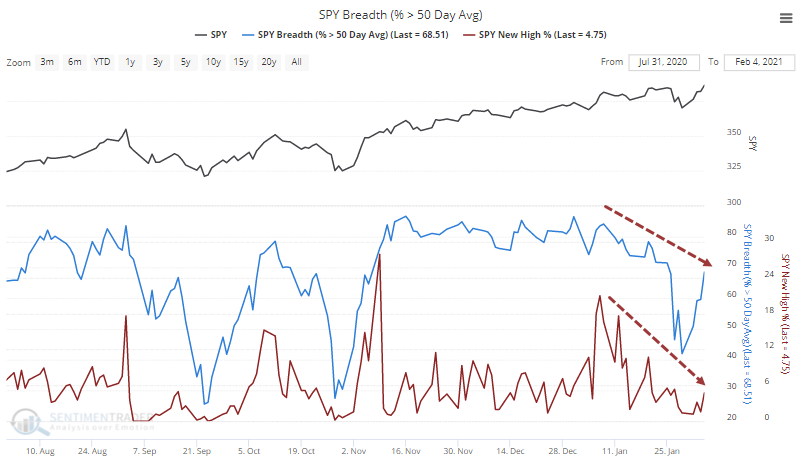
There were few to none of those warnings up until the last couple of weeks. When stocks moved to their highs in late January, some of them started to trigger. After the mini-panic last week, we were watching to see if a move back to new highs would be accompanied by more signs of internal deterioration.

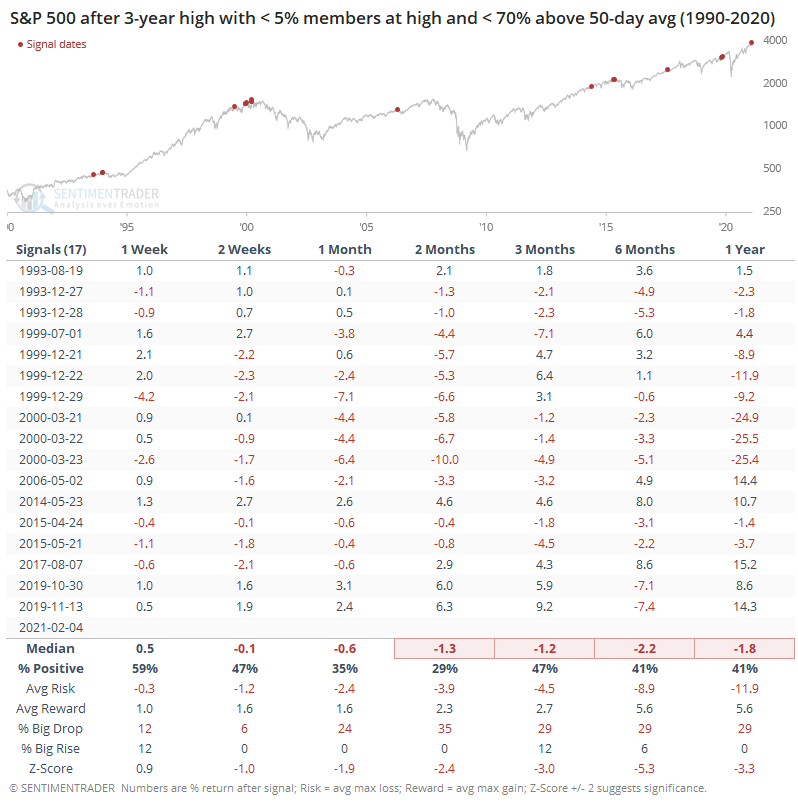
It's not to the point where it's pound-the-table obvious, but there are certainly more signs now than before. The S&P 500 moved to a record high, but fewer than 5% of its member stocks also hit a high on Thursday. And fewer than 70% of them have even made it above their 50-day moving averages.

This kind of move has been decidedly negative for forward returns.

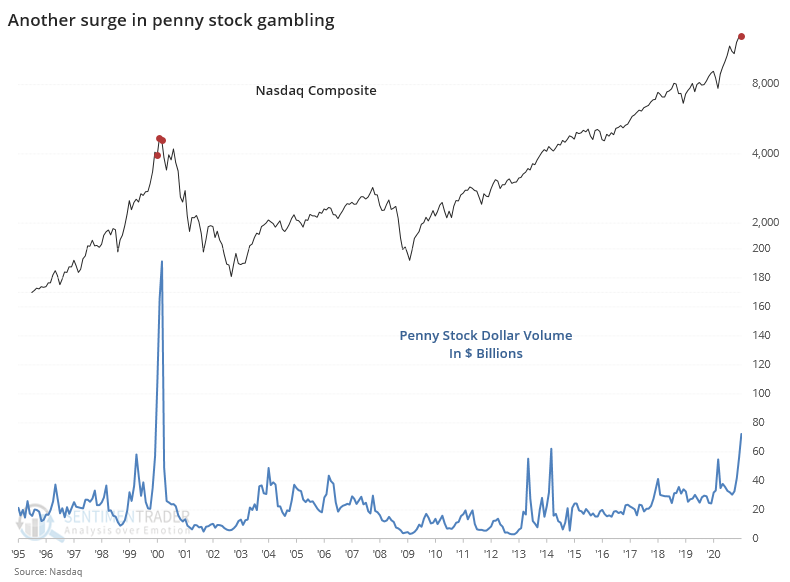
Not that we need more signs of excesses, but the latest data on penny stock trading was released for January. These stock jockeys turned over more than $72 billion in volume in these lottery tickets, exceeded by only a few months in 2000.

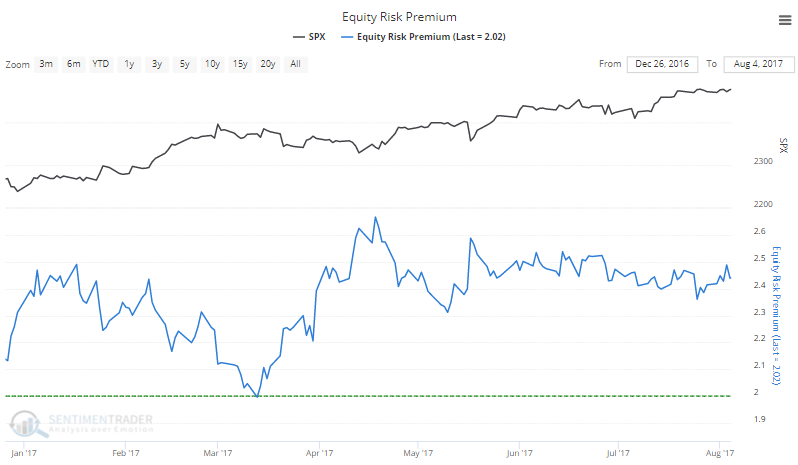
This push to new highs has been excused by the TINA crowd because interest rates are so low, there's nowhere else to invest. Even so, the combination of rising prices and still-weak earnings (like we saw yesterday) has pushed the Equity Risk Premium to nearly the lowest level in the past decade. Granted, it's still high over the long-term, so there is a lot of room for this to move still lower. We're just looking at recent history here.

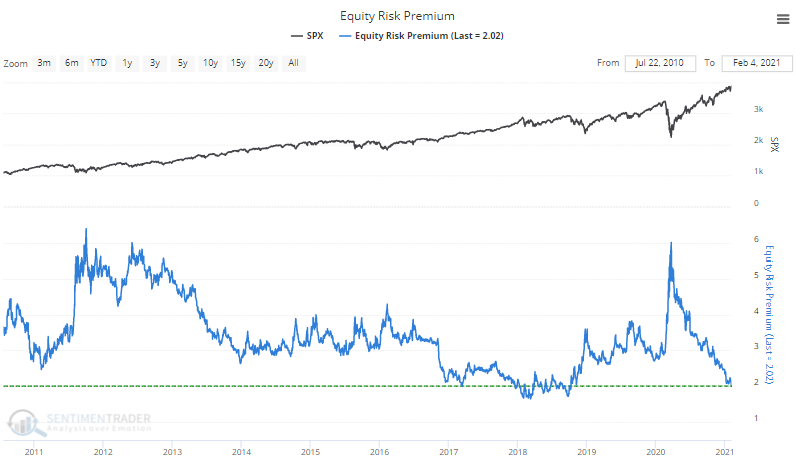
When it got this low in 2017, stocks took about a month-long breather.

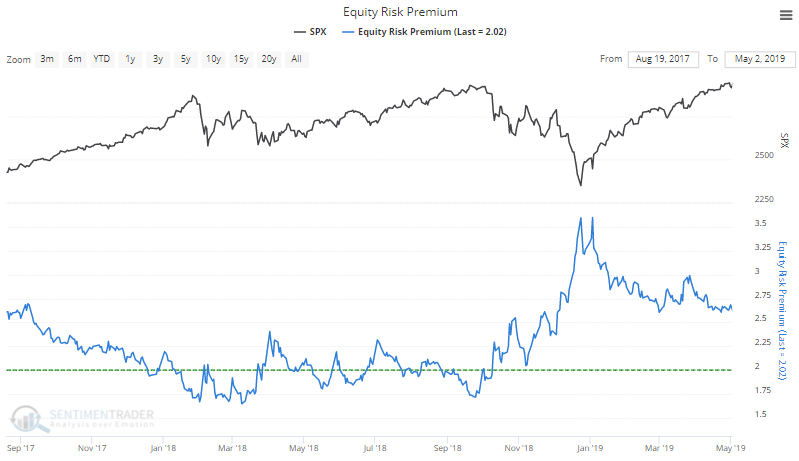
In 2018, it led to a much choppier market, for much longer.

Any sign of price exhaustion and false breakouts in the coming day(s) given these developments would be a major cause for concern.

PRODUCTS
SentimenTrader
Trading Tools
Indicators & Data API
‍
Strategies & Scanner
‍
Research Reports
FREE
RESOUrCES
Simple Backtest
Calculator
Simple Seasonality
Calculator
The Kelly Criterion
Calculator
Sentiment Geo Map
‍
Public Research Reports
‍
Education
Sentiment Indicators
‍
Technical Indicators
‍
Pricing
Bundle pricing
‍
FAQ
‍
Announcements
‍
COMPANY
‍
About
‍
In the News
‍
Testimonials
‍
Client Success Stories
CONTACT
‍
General Inquiries
‍
Media Inquiries
‍
Financial Professionals Inquiries
‍
© 2026 Sundial Capital Research Inc. All rights reserved.
Setsail Marketing
TermsPrivacyAffiliate Program
Risk Disclosure: The information and tools provided are for research and analytical purposes only and are not intended as investment advice. Market analysis involves uncertainty, and outcomes may differ from expectations. Users should conduct their own due diligence and consider their individual circumstances before making any financial decisions. Past performance is not necessarily indicative of future results.

Hypothetical Performance Disclosure: Hypothetical performance results have many inherent limitations, some of which are described below. No representation is being made that any account will or is likely to achieve profits or losses similar to those shown; in fact, there are frequently sharp differences between hypothetical performance results and the actual results subsequently achieved by any particular trading program. One of the limitations of hypothetical performance results is that they are generally prepared with the benefit of hindsight. In addition, hypothetical trading does not involve financial risk, and no hypothetical trading record can completely account for the impact of financial risk of actual trading. for example, the ability to withstand losses or to adhere to a particular trading program in spite of trading losses are material points which can also adversely affect actual trading results. There are numerous other factors related to the markets in general or to the implementation of any specific trading program which cannot be fully accounted for in the preparation of hypothetical performance results and all which can adversely affect trading results.

Testimonial Disclosure: Testimonials appearing on this website may not be representative of other clients or customers and is not a guarantee of future performance or success.