Products
SentimenTrader Trading Tools
‍
Backtest Engine
My Trading Toolkit
Correlation Analysis
Seasonality
Market Prediction
Indicators & Data API
‍
Proprietary Indicators & Charts
Market Data API
Strategies & Scanner
‍
50+ Trading Strategies
Smart Stock Scanner
Smart Option Scanner
Research Reports
‍
Research Solutions
Reports Library
Free Resources
Simple Backtest Calculator
Simple Seasonality Calculator
The Kelly Criterion Calculator
Sentiment Geo Map
Public Research Reports
Education
Sentiment Indicators
Technical Indicators
Pricing
Company
About
In the News
Testimonials
Client Success Stories
Contact
Log inLoginSign up
< BACK TO ALL REPORTS

A ray of hope for stocks from high yield bonds

Jay Kaeppel
2022-01-26
The performance of high-yield bonds and stocks is tied to the overall economic trend. As a result, their performance is highly correlated. Historically, when high yield bonds reach an extreme, there are often significant implications for the stock market.

Key Points

  • High yield bonds are highly correlated with the stock market
  • The High Yield New High - New Low series occasionally reaches extreme levels
  • Reversals from extreme readings often give helpful information for stock traders

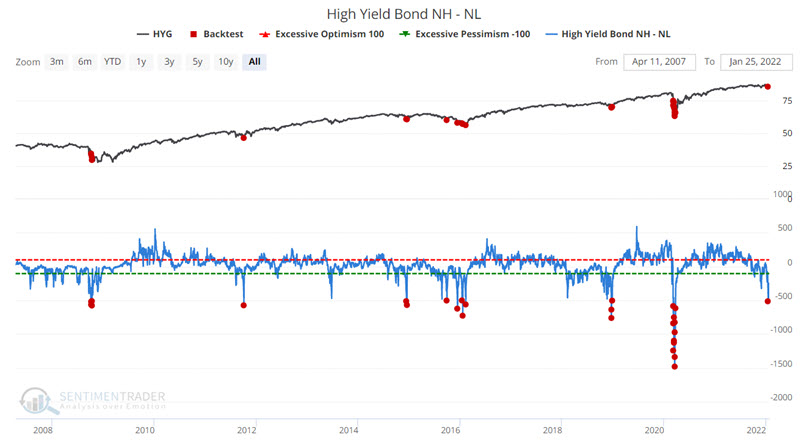
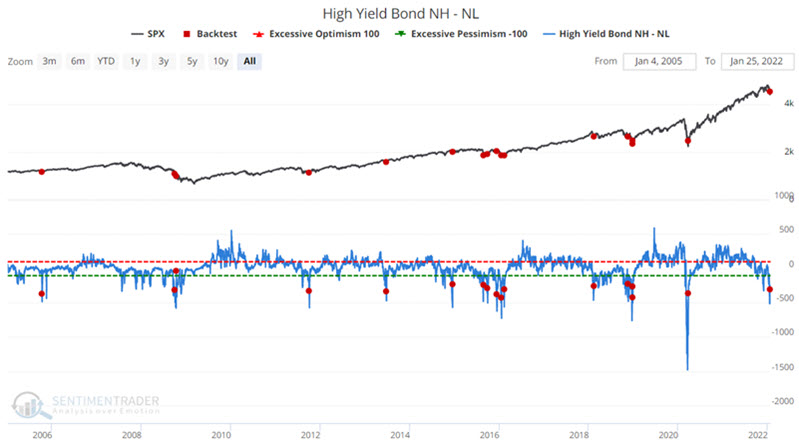
High Yield Bond NH - NL indicator

This indicator shows the net number of high-yield bonds that set a 52-week high minus those that set a 52-week low on the day, per FINRA TRACE. It can be beneficial as an overbought/oversold type of indicator.

The chart below displays HYG (iShares iBoxx $ High Yield Corporate Bond ETF), and the red dots highlight those days when the High Yield NH - NL indicator read -500 or lower.

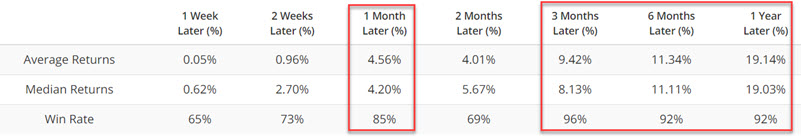
The table below displays a summary of HYG performance following all days when the indicator read -500 or lower (including overlaps). Note the high Win Rate for 1, 3, 6, and 12-month periods.

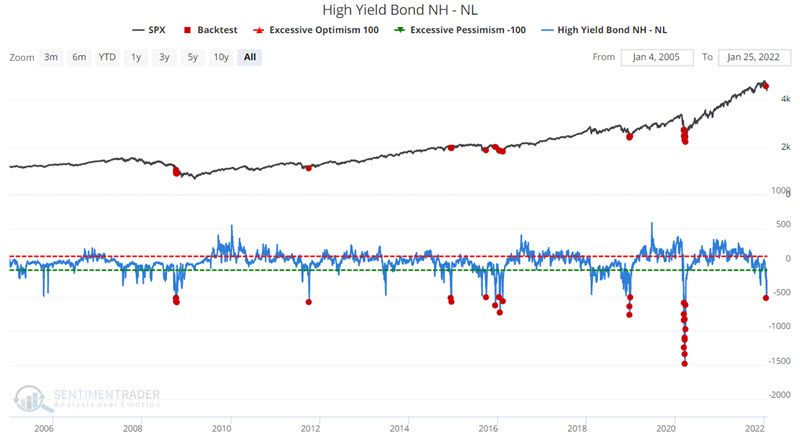
Now let's turn our attention to stocks. The chart below displays the S&P 500, and the red dots highlight those days when the High Yield NH - NL indicator read -500 or lower.

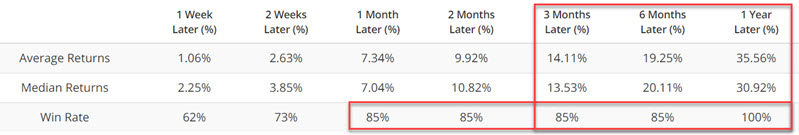
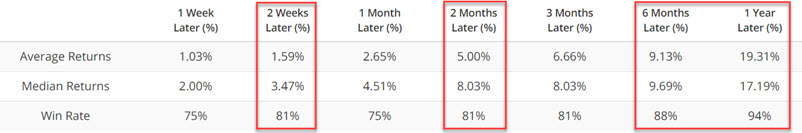
The table below displays a summary of SPX performance following all days when the indicator read -500 or lower (including overlaps). Note the high Win Rate for all periods from 1-month to 12-months. Also, note the robust returns for three months to 12 months.

As a trading signal

The results above include all days when an indicator reading of -500 or lower was in force. To better illustrate the potential usefulness of this indicator, let's consider a slightly different take. 

The chart below displays the S&P 500, and the red dots highlight those days when the High Yield NH - NL indicator crossed above -450. In other words, the value must drop below -450 and then cross back above that level as a sort of confirmation signal.

The table below displays a summary of SPX performance following all days when the indicator crossed above -450. The results are slightly less robust than the earlier test but still show a high degree of bullish consistency and solid rates of return.

What the research tells us…

The recent sharp decline and rebound in the High Yield NH - NL indicator qualifies as a favorable sign for stocks in the months ahead. That said, investors should consider this factor as part of an overall "weight of the evidence" approach rather than as a standalone trading model.

PRODUCTS
SentimenTrader
Trading Tools
Indicators & Data API
‍
Strategies & Scanner
‍
Research Reports
FREE
RESOUrCES
Simple Backtest
Calculator
Simple Seasonality
Calculator
The Kelly Criterion
Calculator
Sentiment Geo Map
‍
Public Research Reports
‍
Education
Sentiment Indicators
‍
Technical Indicators
‍
Pricing
Bundle pricing
‍
FAQ
‍
Announcements
‍
COMPANY
‍
About
‍
In the News
‍
Testimonials
‍
Client Success Stories
CONTACT
‍
General Inquiries
‍
Media Inquiries
‍
Financial Professionals Inquiries
‍
© 2026 Sundial Capital Research Inc. All rights reserved.
Setsail Marketing
TermsPrivacyAffiliate Program
Risk Disclosure: The information and tools provided are for research and analytical purposes only and are not intended as investment advice. Market analysis involves uncertainty, and outcomes may differ from expectations. Users should conduct their own due diligence and consider their individual circumstances before making any financial decisions. Past performance is not necessarily indicative of future results.

Hypothetical Performance Disclosure: Hypothetical performance results have many inherent limitations, some of which are described below. No representation is being made that any account will or is likely to achieve profits or losses similar to those shown; in fact, there are frequently sharp differences between hypothetical performance results and the actual results subsequently achieved by any particular trading program. One of the limitations of hypothetical performance results is that they are generally prepared with the benefit of hindsight. In addition, hypothetical trading does not involve financial risk, and no hypothetical trading record can completely account for the impact of financial risk of actual trading. for example, the ability to withstand losses or to adhere to a particular trading program in spite of trading losses are material points which can also adversely affect actual trading results. There are numerous other factors related to the markets in general or to the implementation of any specific trading program which cannot be fully accounted for in the preparation of hypothetical performance results and all which can adversely affect trading results.

Testimonial Disclosure: Testimonials appearing on this website may not be representative of other clients or customers and is not a guarantee of future performance or success.