Indicators &
Backtest Tools
Research
Reports
Report Solutions
Reports Library
Strategies
& Scanner
Free
Resources
Simple Backtest Calculator
Simple Seasonality Calculator
The Kelly Criterion Calculator
Sentiment Geo Map
Public Research Reports
Free Webinar
Pricing
Company
About
In the News
Testimonials
Client Success Stories
Contact
Log inLoginSign up
< BACK TO ALL REPORTS

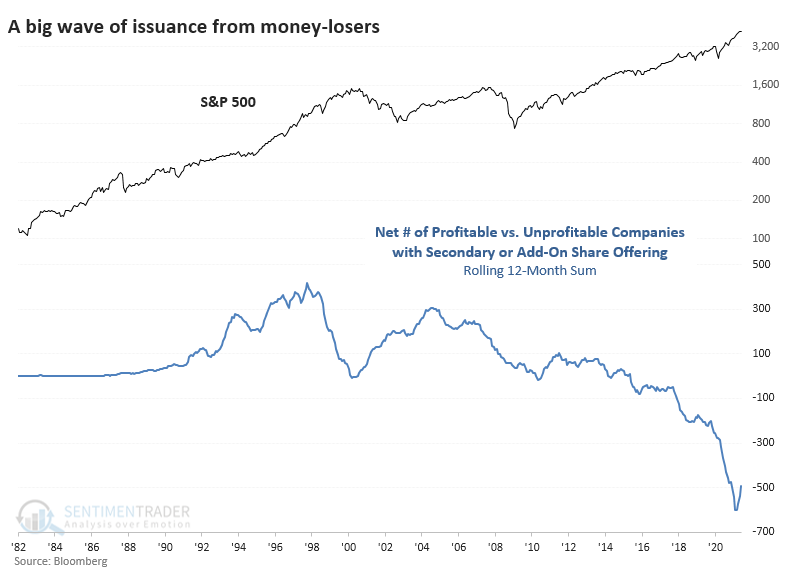
A Record Glut of Shares from Money Losers

Jason Goepfert
2021-06-24
There has been a surge of secondary issuance of shares by U.S. companies in recent months. Even more notable, much of that issuance has come from companies that have negative net income.

A rising tide lifts all boats in life and markets. And the rising tide of money has lifted the fortunes of many companies that otherwise would have sunk long ago.

As the Wall Street Journal notes:

"The frenzied stock-buying activity that may have saved AMC Entertainment Holdings Inc. from bankruptcy is opening up a potential escape hatch for other troubled borrowers as well.

More companies with steep financial challenges are seeking a lifeline from equity markets, eager to capitalize on the surge of interest in stock buying from nonprofessional investors.

But equity markets now are more open to supporting troubled issuers, in large part because of risk-hungry individual investors eager to speculate, according to bankers and investors following the trend."

We can see this explicitly in the amount of money raised from secondary and add-on share issuance between money-making and money-losing corporations in the U.S. In March, we looked at the explosion in IPOs, which has been a concern for a while. 

A TREND TOWARD MONEY-LOSERS

According to Bloomberg data, there have been 254 profitable companies issuing secondary or add-on shares over the past 12 months. But there have been 748 unprofitable companies doing the same, for a net differential of more than 500 companies.

All of this issuance amounted to more than $27 billion worth of offerings that have been priced. That, too, is a record amount dating back 40 years.

ONLY TWO HISTORICAL PRECEDENTS

As a percentage of the U.S. equity market, this is about 0.1%, which is nothing more than a blip. That's not really the point. It's not about the amount of issuance; it's about a market environment that allows this to happen.

We've been in the Enthusiasm phase of a Typical Sentiment Cycle for more than six months now. The phase usually exhibits all of these factors.

  • High optimism
  • Easy credit (too easy, with loose terms)
  • A rush of initial and secondary offerings
  • Risky stocks outperforming
  • Stretched valuations

Optimism has ebbed from its peak in February, and some risky stocks have been clobbered. However, the other factors are still in play. We need to be on the lookout for internal divergences and warnings among technical indicators during and after these phases. So far, those have been spotty. We'll have to watch if conditions like we saw earlier this week continue. 

Sorry, you don't have access to this report

Upgrade your subscription plan to get access
Go to Dasboard
Indicators & Backtest Tools
IndicatorEdge
‍
BackTestEdge
‍
Other Tools
‍
DataEdge API
RESEARCH
reports
Research Solution
‍
Reports Library
‍
Strategies & Scanner
Trading Strategies
‍
Smart Stock Scanner
‍
FREE
RESOUrCES
Simple Backtest
Calculator
Simple Seasonality
Calculator
The Kelly Criterion
Calculator
Sentiment Geo Map
‍
Public Research Reports
‍
Free Webinar
COMPANY
‍
About
‍
In the News
‍
Testimonials
‍
Client Success Stories
Pricing
Bundle pricing
‍
Announcements
‍
FAQ
© 2025 Sundial Capital Research Inc. All rights reserved.
Setsail Marketing
TermsPrivacyAffiliate Program
Risk Disclosure: Futures and forex trading contains substantial risk and is not for every investor. An investor could potentially lose all or more than the initial investment. Risk capital is money that can be lost without jeopardizing ones’ financial security or life style. Only risk capital should be used for trading and only those with sufficient risk capital should consider trading. Past performance is not necessarily indicative of future results.

Hypothetical Performance Disclosure: Hypothetical performance results have many inherent limitations, some of which are described below. No representation is being made that any account will or is likely to achieve profits or losses similar to those shown; in fact, there are frequently sharp differences between hypothetical performance results and the actual results subsequently achieved by any particular trading program. One of the limitations of hypothetical performance results is that they are generally prepared with the benefit of hindsight. In addition, hypothetical trading does not involve financial risk, and no hypothetical trading record can completely account for the impact of financial risk of actual trading. for example, the ability to withstand losses or to adhere to a particular trading program in spite of trading losses are material points which can also adversely affect actual trading results. There are numerous other factors related to the markets in general or to the implementation of any specific trading program which cannot be fully accounted for in the preparation of hypothetical performance results and all which can adversely affect trading results.

Testimonial Disclosure: Testimonials appearing on this website may not be representative of other clients or customers and is not a guarantee of future performance or success.