Products
SentimenTrader Trading Tools
‍
Backtest Engine
My Trading Toolkit
Correlation Analysis
Seasonality
Market Prediction
Indicators & Data API
‍
Proprietary Indicators & Charts
Market Data API
Strategies & Scanner
‍
50+ Trading Strategies
Smart Stock Scanner
Smart Option Scanner
Research Reports
‍
Research Solutions
Reports Library
Free Resources
Simple Backtest Calculator
Simple Seasonality Calculator
The Kelly Criterion Calculator
Sentiment Geo Map
Public Research Reports
Education
Sentiment Indicators
Technical Indicators
Pricing
Company
About
In the News
Testimonials
Client Success Stories
Contact
Log inLoginSign up
< BACK TO ALL REPORTS

A reversal in optimism suggests higher energy stocks

Dean Christians
2022-01-10
The Optimism Index reversed from a pessimistic level relative to its recent range, triggering a buy signal for the energy sector.

Key points:

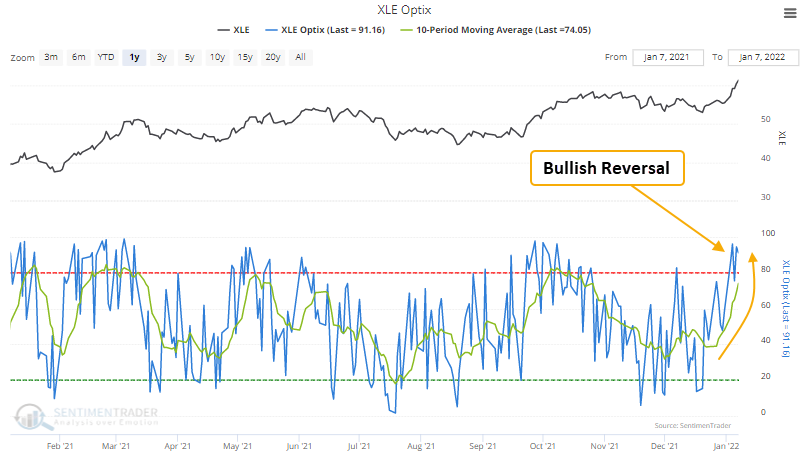
  • The optimism index for the energy sector reversed higher relative to its recent range
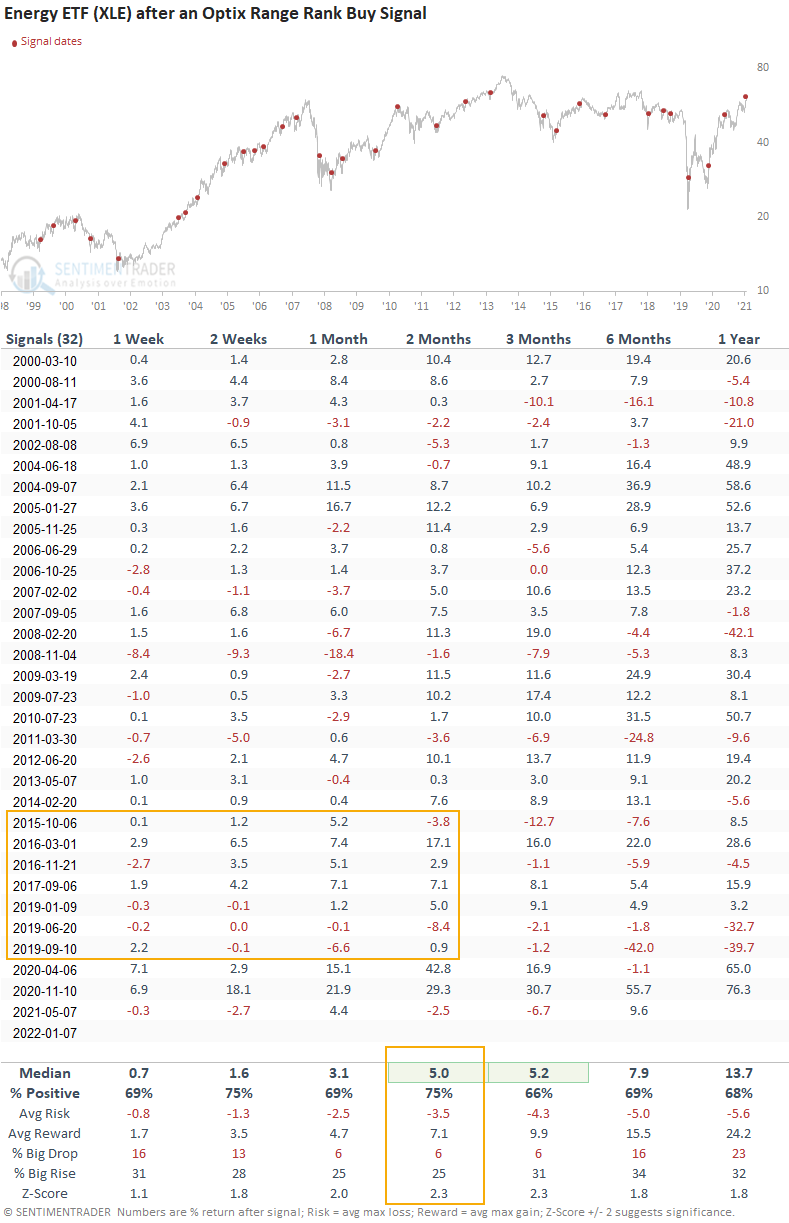
  • The energy ETF (XLE) has rallied 75% of the time over the next 2 months after other signals

Using the optimism index as a way to identify bullish sentiment reversals

A trading model that uses the Optix Index to identify when sentiment reverses from a period of pessimism issued a buy signal for the energy sector on 1/7/22. 

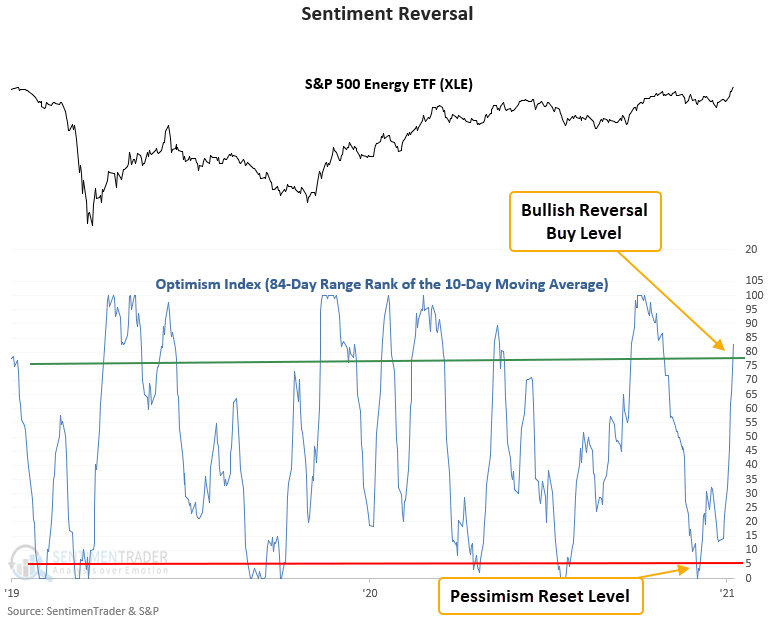
The model applies an 84-day range rank to the 10-day moving average of the Optimism Index for the XLE ETF. As a reminder, the range rank indicator measures the current value relative to all other values over a lookback period. 100 is the highest, and 0 is the lowest. The pessimistic reset condition is confirmed when the range rank for the Optix Index crosses below the 5th percentile. A new buy signal occurs when the range rank crosses back above the 78th percentile. At the same time, the 5-day rate of change for the XLE ETF must be >= 3%. i.e., market momentum is positive.

A trading model that identifies a reversal in the Optix Index

Energy stocks rallied 75% of the time after other signals

This signal has triggered 32 other times over the past 22 years. After the others, energy sector future returns, win rates, and risk/reward profiles were solid across all time frames, especially the 2-month window. The trading model performed well during the most recent energy bear market period between 2014-2020, with positive returns at some point up to 2 months later in 6 out of 7 instances.

Signals when the XLE ETF is trading above its 200-day moving average

This signal has triggered 18 other times over the past 22 years. After the others, energy sector future returns, win rates, and risk/reward profiles were solid across almost all time frames. Comparing the two signal types shows that the trend filter instances'  look slightly more favorable in the 1 & 2-month time frames across most metrics. The 200-day filter showed solid results in the 2003-8 energy bull cycle, with 9 out of 9 winners at some point up to 2 months later.

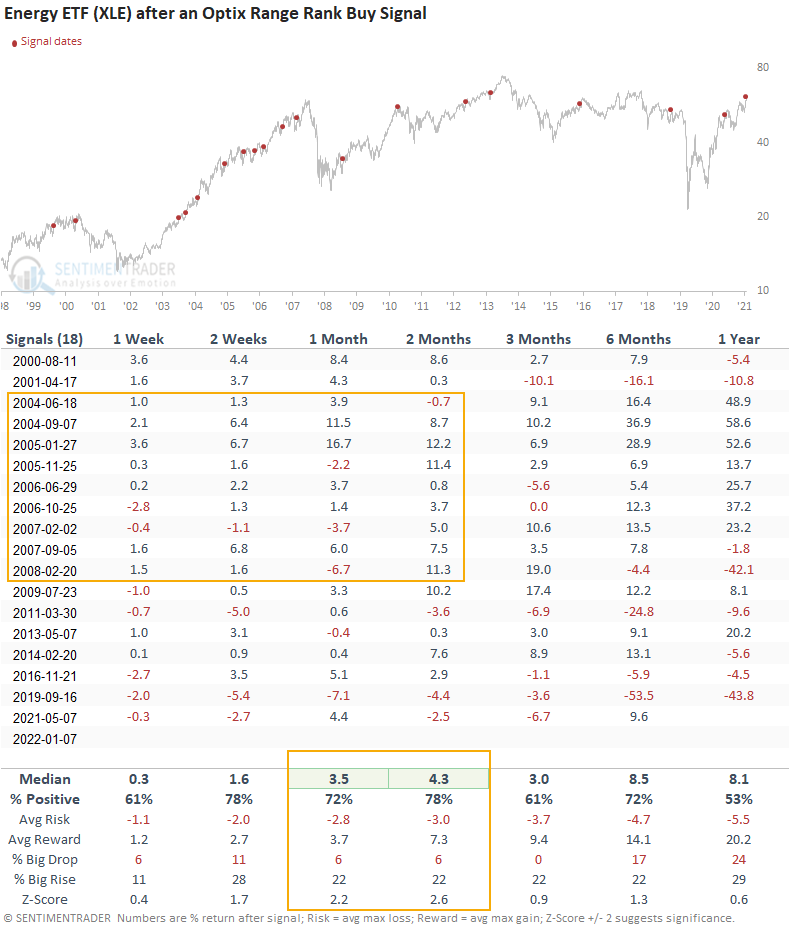
What the research tells us...

When the Optimism Index for the energy sector reverses from a pessimist level relative to its recent range, it signals that traders have become more optimistic about the future direction of energy stocks. Using the Optix index to measure that change in sentiment, similar setups to what we're seeing now have preceded rising energy sector prices, especially in the 2-month window.

PRODUCTS
SentimenTrader
Trading Tools
Indicators & Data API
‍
Strategies & Scanner
‍
Research Reports
FREE
RESOUrCES
Simple Backtest
Calculator
Simple Seasonality
Calculator
The Kelly Criterion
Calculator
Sentiment Geo Map
‍
Public Research Reports
‍
Education
Sentiment Indicators
‍
Technical Indicators
‍
Pricing
Bundle pricing
‍
FAQ
‍
Announcements
‍
COMPANY
‍
About
‍
In the News
‍
Testimonials
‍
Client Success Stories
CONTACT
‍
General Inquiries
‍
Media Inquiries
‍
Financial Professionals Inquiries
‍
© 2026 Sundial Capital Research Inc. All rights reserved.
Setsail Marketing
TermsPrivacyAffiliate Program
Risk Disclosure: The information and tools provided are for research and analytical purposes only and are not intended as investment advice. Market analysis involves uncertainty, and outcomes may differ from expectations. Users should conduct their own due diligence and consider their individual circumstances before making any financial decisions. Past performance is not necessarily indicative of future results.

Hypothetical Performance Disclosure: Hypothetical performance results have many inherent limitations, some of which are described below. No representation is being made that any account will or is likely to achieve profits or losses similar to those shown; in fact, there are frequently sharp differences between hypothetical performance results and the actual results subsequently achieved by any particular trading program. One of the limitations of hypothetical performance results is that they are generally prepared with the benefit of hindsight. In addition, hypothetical trading does not involve financial risk, and no hypothetical trading record can completely account for the impact of financial risk of actual trading. for example, the ability to withstand losses or to adhere to a particular trading program in spite of trading losses are material points which can also adversely affect actual trading results. There are numerous other factors related to the markets in general or to the implementation of any specific trading program which cannot be fully accounted for in the preparation of hypothetical performance results and all which can adversely affect trading results.

Testimonial Disclosure: Testimonials appearing on this website may not be representative of other clients or customers and is not a guarantee of future performance or success.