Products
SentimenTrader Trading Tools
‍
Backtest Engine
My Trading Toolkit
Correlation Analysis
Seasonality
Indicators & Data API
‍
Proprietary Indicators & Charts
Market Data API
Strategies & Scanner
‍
50+ Trading Strategies
Smart Stock Scanner
Research Reports
‍
Research Solutions
Reports Library
Free Resources
Simple Backtest Calculator
Simple Seasonality Calculator
The Kelly Criterion Calculator
Sentiment Geo Map
Public Research Reports
Pricing
Company
About
In the News
Testimonials
Client Success Stories
Contact
Log inLoginSign up
< BACK TO ALL REPORTS

A Reversal Signal With a Perfect Record

Jason Goepfert
2021-07-21
After heavy selling on Monday, buyers more than made up for it with buying pressure on Tuesday. That triggered a back-to-back reversal in the Up Volume Ratio, which has been a very good sign for future returns.

Some selling pressure to start the week made sense. There were ample and increasing signs of deterioration under the surface of the indexes, and it finally caught up to them.

In yet another concerted effort to buy every dip, though, that weakness lasted all of about one day. The buying stampede on Tuesday was remarkable, and it more than reversed the selling pressure from the day before.

The Up Volume Ratio cycled from below 15% to above 85% in back-to-back sessions on the NYSE.

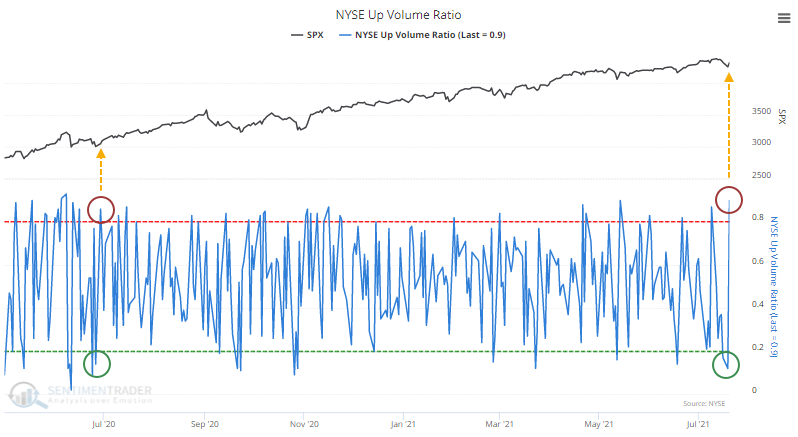
This triggered last June, and it marked the end of that little pullback, kicking off an impressive run over the next few months. That was much more the rule than the exception after a back-to-back reversal in Up Volume while the S&P 500 was within 10% of a 52-week high.

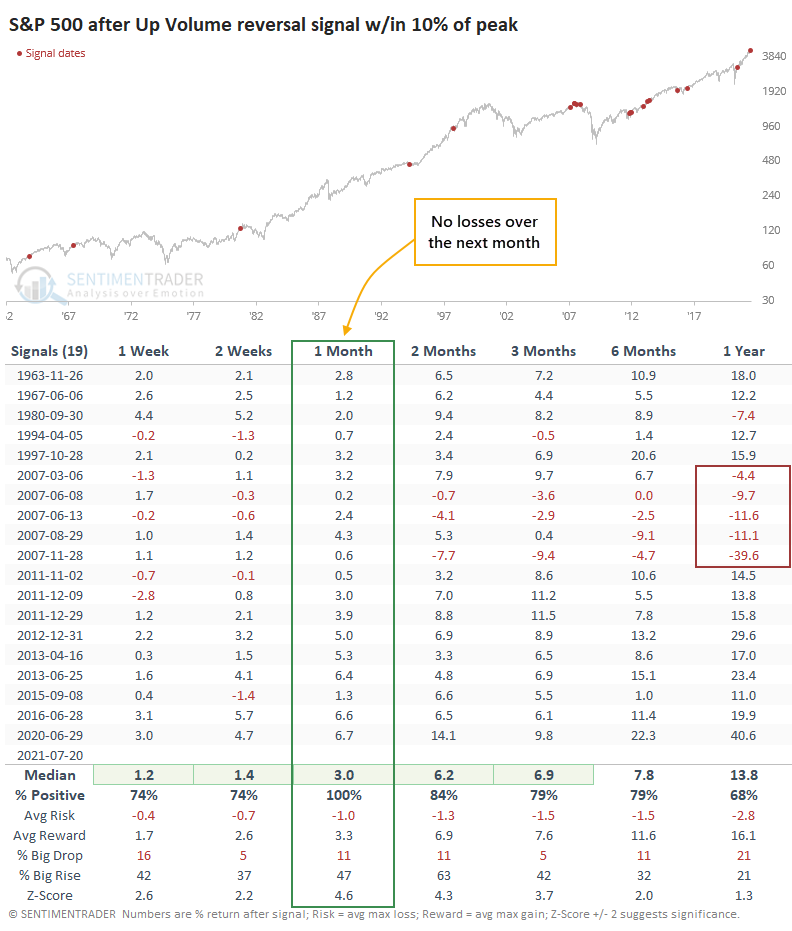
Since 1962, the S&P 500 never showed a loss in the month following similar signals. These mostly occurred during momentum markets, and buyers followed through to avoid missing out on the next bull run. A few of them did end up leading to blow-off peaks, but not until month(s) later.

This contrasts with signals triggered when the S&P was more than 10% below its high.

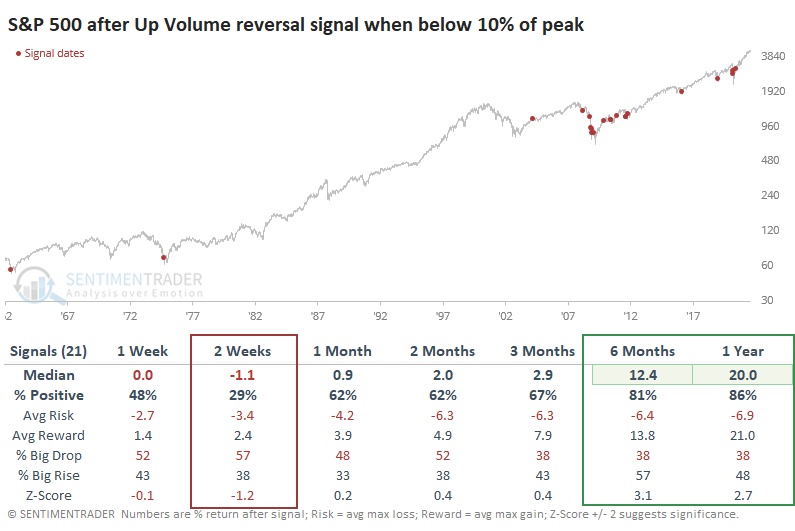
While most of these triggered in the aftermath of a severe decline, with impressive long-term returns, there was much more of a tendency to see stocks fall back in the next couple of weeks.

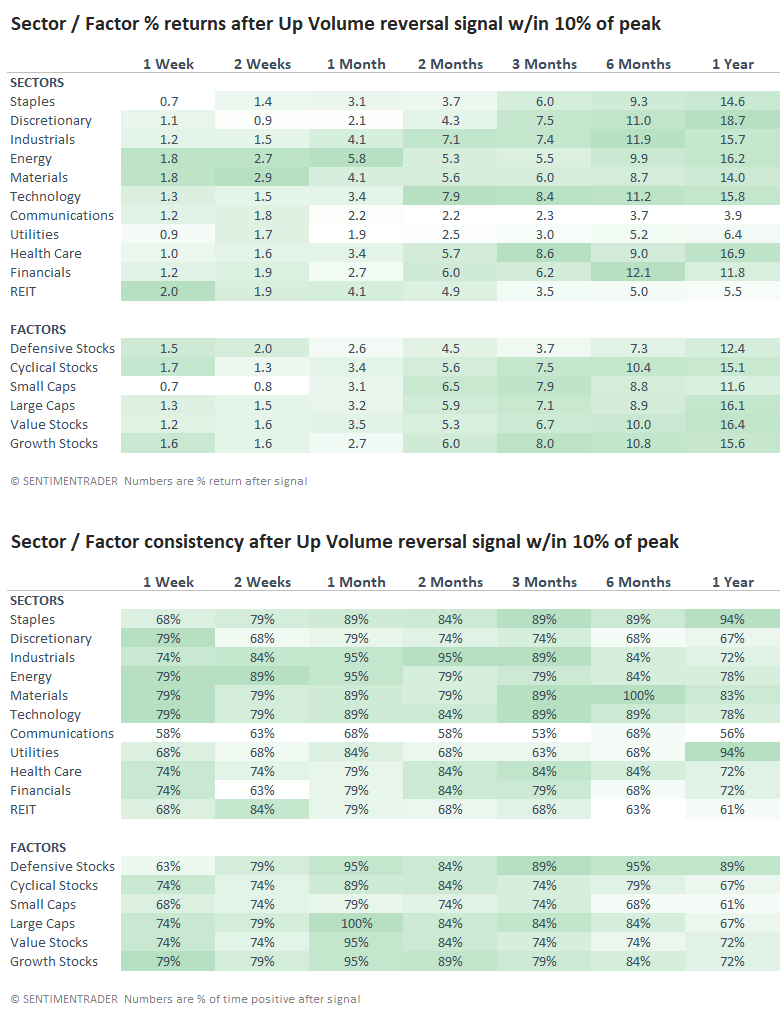
For sectors and factors, these volume reversals preceded a sea of green.

The selling on Monday was "comfortable" in that it made sense given the pressures that had been building under the surface. While some specific sectors showed some decent oversold signals, for the market as a whole, most of what we looked at suggested that it would be more likely to see further selling pressure in the weeks ahead. More and more risk-off signals were triggering, and those have a good history of preceding weak markets.

It's iffy to put a ton of weight on a single session, and Tuesday didn't make up for all the worries that have been building. At the same time, it's tough to ignore the implications of similar back-to-back volume reversals. It seemed like things were finally starting to move in bears' favor, but after Tuesday, it's hard to have much faith in that, either.

PRODUCTS
SentimenTrader
Trading Tools
Indicators & Data API
‍
Strategies & Scanner
‍
Research Reports
FREE
RESOUrCES
Simple Backtest
Calculator
Simple Seasonality
Calculator
The Kelly Criterion
Calculator
Sentiment Geo Map
‍
Public Research Reports
‍
Pricing
Bundle pricing
‍
Announcements
‍
FAQ
COMPANY
‍
About
‍
In the News
‍
Testimonials
‍
Client Success Stories
CONTACT
‍
General Inquiries
‍
Media Inquiries
‍
Financial Professionals Inquiries
‍
© 2025 Sundial Capital Research Inc. All rights reserved.
Setsail Marketing
TermsPrivacyAffiliate Program
Risk Disclosure: Futures and forex trading contains substantial risk and is not for every investor. An investor could potentially lose all or more than the initial investment. Risk capital is money that can be lost without jeopardizing ones’ financial security or life style. Only risk capital should be used for trading and only those with sufficient risk capital should consider trading. Past performance is not necessarily indicative of future results.

Hypothetical Performance Disclosure: Hypothetical performance results have many inherent limitations, some of which are described below. No representation is being made that any account will or is likely to achieve profits or losses similar to those shown; in fact, there are frequently sharp differences between hypothetical performance results and the actual results subsequently achieved by any particular trading program. One of the limitations of hypothetical performance results is that they are generally prepared with the benefit of hindsight. In addition, hypothetical trading does not involve financial risk, and no hypothetical trading record can completely account for the impact of financial risk of actual trading. for example, the ability to withstand losses or to adhere to a particular trading program in spite of trading losses are material points which can also adversely affect actual trading results. There are numerous other factors related to the markets in general or to the implementation of any specific trading program which cannot be fully accounted for in the preparation of hypothetical performance results and all which can adversely affect trading results.

Testimonial Disclosure: Testimonials appearing on this website may not be representative of other clients or customers and is not a guarantee of future performance or success.