
A sector split not seen since 1932

Several times in recent weeks, we've looked at a type of split in stocks, with the winners doing very well indeed, while the rest of the market just kind of limps along.
This year has highlighted the importance of being in the right sector more than any year since 1932. Through August, there hasn't been such a wide chasm between the best and worst sectors in nearly 90 years.
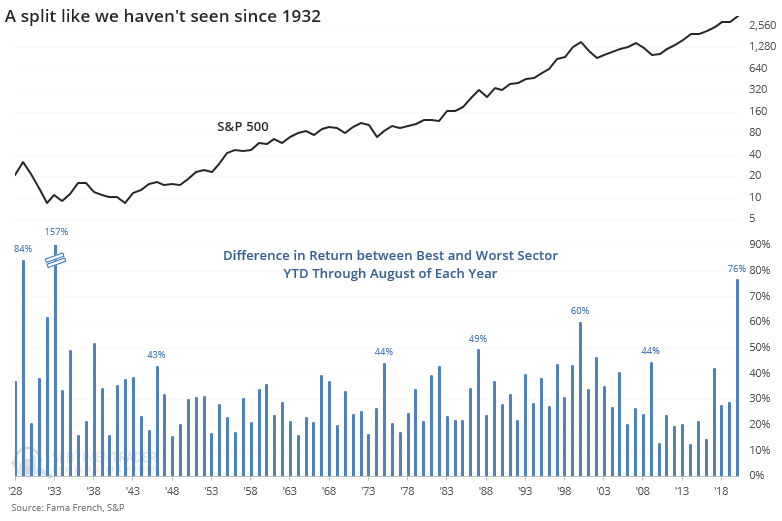
The only years in that span when the difference neared or exceeded 50% were 1987 and 2000. That doesn't seem like a great sign.
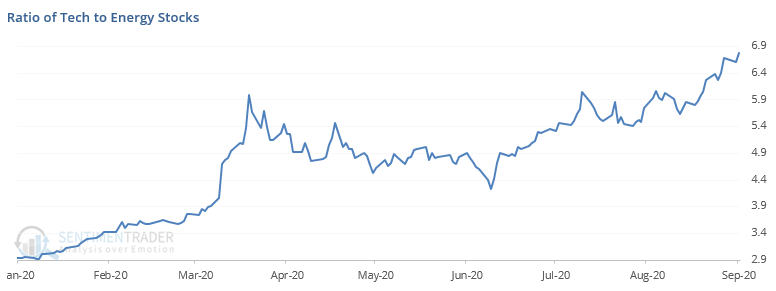
This is thanks to the money pouring into the big tech stocks while neglecting left-for-dead sectors like energy. This is a repeat of what happened in 2017 but on steroids. Below, we can see the ratio between the tech and energy sectors so far in 2020 - it has kicked into high gear since June.
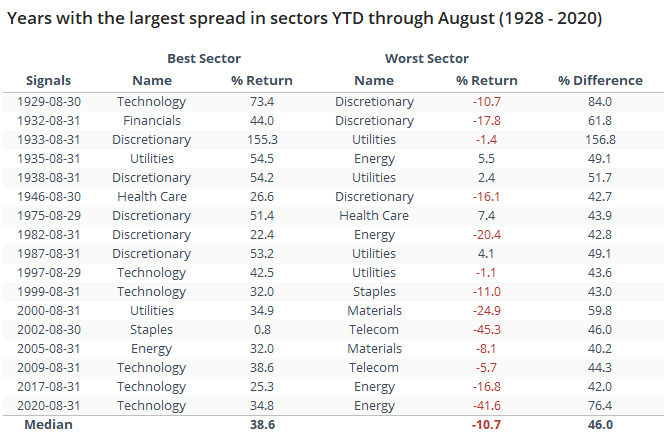
Going back to 1928, the table below shows the difference between the best-performing and worst-performing major sectors through August. Only years when the difference was more than 40% are shown.
As always, a good question to ask is, "So what?"
The charts below show the ratio between the best and worst sectors for each year in the table above. They show the ratio from January through the end of the next two years to give a broader view of what happened after sector splits that were so extreme. They are ordered with the most recent on top.
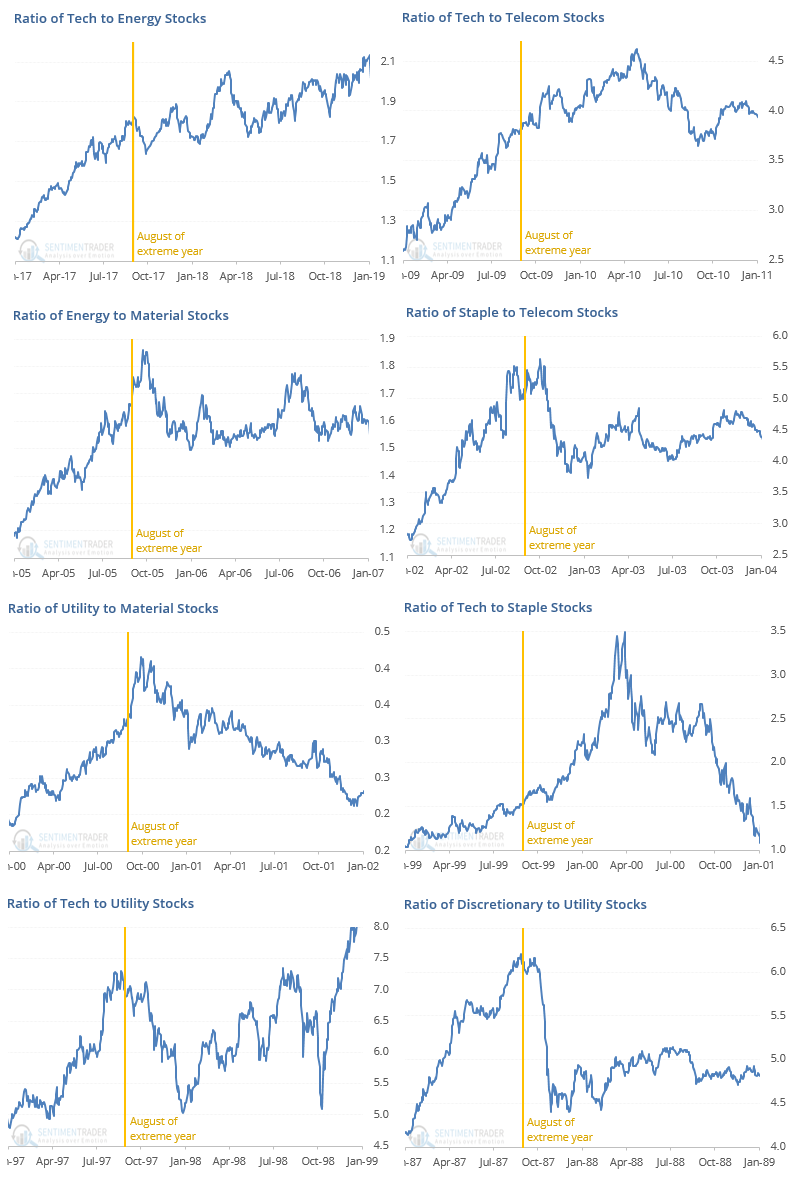
Over the past ~40 years, there were 8 years with a wide split in sectors. After 4 of those, the ratio between those sectors peaked or was close to it, at least for several months but usually for much longer. Only 2 of them (2009 and 1999) didn't really see any interruption of the trend for at least the next 6 months. The other 2 (2005 and 2000) saw the ratio go into hyper-drive as the sectors split even further into the early winter months, then reversed hard over the next year.
Going back further, we can see a similar pattern.
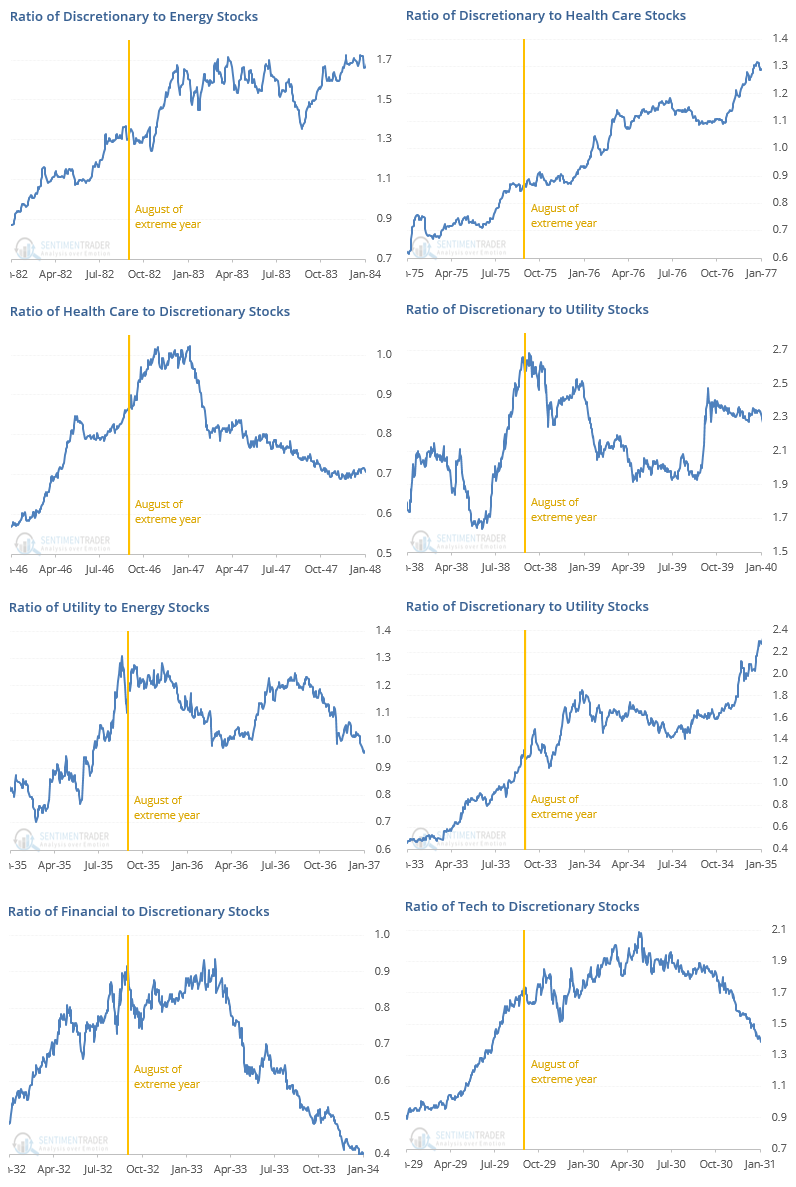
Out of the signals, 4 of them saw a reversal or plateau in the ratio, and 3 of them saw a temporary pause before the trend resumed. The other (1946) saw the ratio go parabolic into year-end then reverse hard longer-term.
Every time there is a split like this, investors make extrapolations about structural changes in the market that explain the difference between the two sectors. Currently, it's that big tech stocks are going to keep benefitting from the post-pandemic world while a focus on renewable energy with a possible change in administrations is going to doom the energy sector. Maybe.
More likely is that by the time these themes have been played out to the degree they have in 2020, future returns have already been sacrificed even if the theories play out. Maybe tech will continue to gain on energy in the months ahead, but historically it would be highly unusual for them to continue to outperform by a meaningful degree over a 1-2 year time frame.