
A Sell Signal in the Cumulative Advance-Decline Line for the Last Hour of Trading

Several years ago, I created a trend following model for the last hour of trading. The model uses a cumulative advance-decline line based upon whether the last hour of trading was up or down. The model calculation is different from the Smart Money Index on the website, but the premise is similar.
I traded for an institutional money manager for 20 years and managed the trading desk for the last 12 years. In my role, I was responsible for analyzing transaction costs for trades. My former firm ran a very concentrated portfolio and had a sizable asset base at one point. It wasn't uncommon to execute block transactions in the 250-500 million dollar range. The transaction cost analysis studies showed a clear pattern.
My trading costs significantly increased when a transaction ran past day one as overnight event risk and trending markets impacted orders. I had an incentive to complete an order on day one, and the last hour of trading was critical.
While I don't use the last hour indicator/model as a primary risk-off signal, it's worth noting when it exits a position. It indicates a higher level of selling pressure in the critical last hour of trading.
Last Hour Indicator Trend Model and Signal
As I stated above, the last indicator is a cumulative advance-decline line for the last hour of trading. If the last hour of trading is up, I add one to the cumulative count. If down, I subtract one from the count. The trend model applies a moving average to the advance-decline line and looks for instances when the count deviates above or below the moving average by a user-defined threshold to signal a trend change. Once a trend change occurs, the model buys or sells the SPY ETF when the ETF trend is favorable or unfavorable.
Let's take a look at the current day signal and a few historical examples.
Last Hour Indicator Intraday Chart
As the chart below shows, selling pressure started to pick up after the first of the year. The trend model turned negative on 1/21/21 after the indicator experienced a down reading in 10/12 trading days.
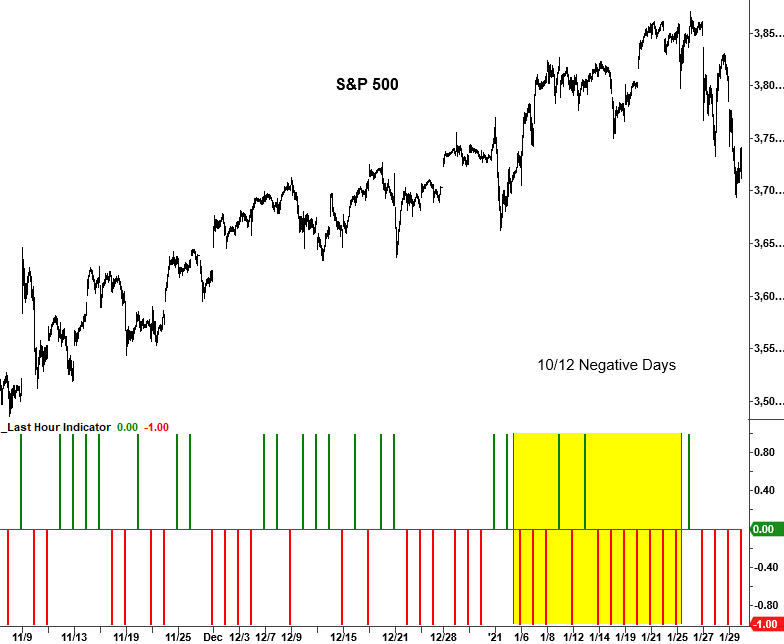
Last Hour Indicator Signal
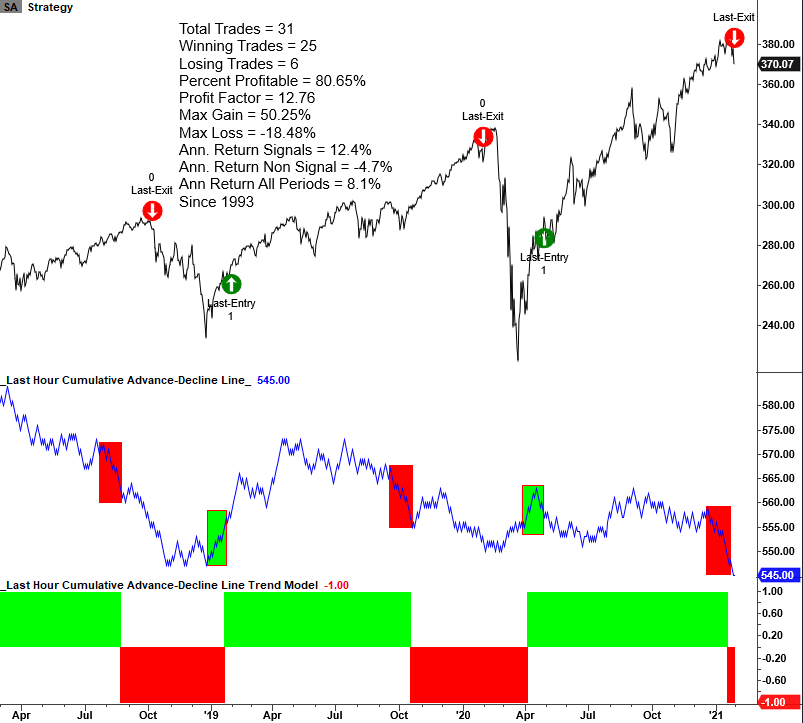
A new sell signal triggered on 1/29/21 after the SPY ETF trend turned unfavorable within the context of a negative trend model reading for the last hour indicator. As one can see in the trading statistics below, the SPY ETF annualizes at a negative 4.7% when the model registers a sell signal. I also highlighted the indicator around trend changes to show how it takes a significant amount of buying or selling pressure in a short period to flip the trend model.
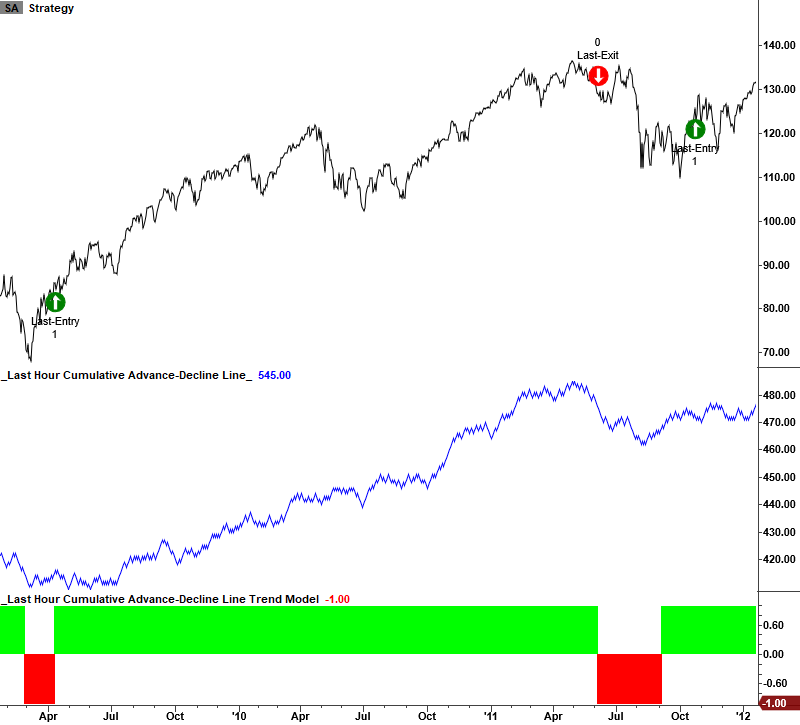
2009-2012 Chart Example
The indicator should advance in a strong uptrend for the broad market. As the chart below shows, the trend model stayed positive for the better part of two years post the 2009 low.
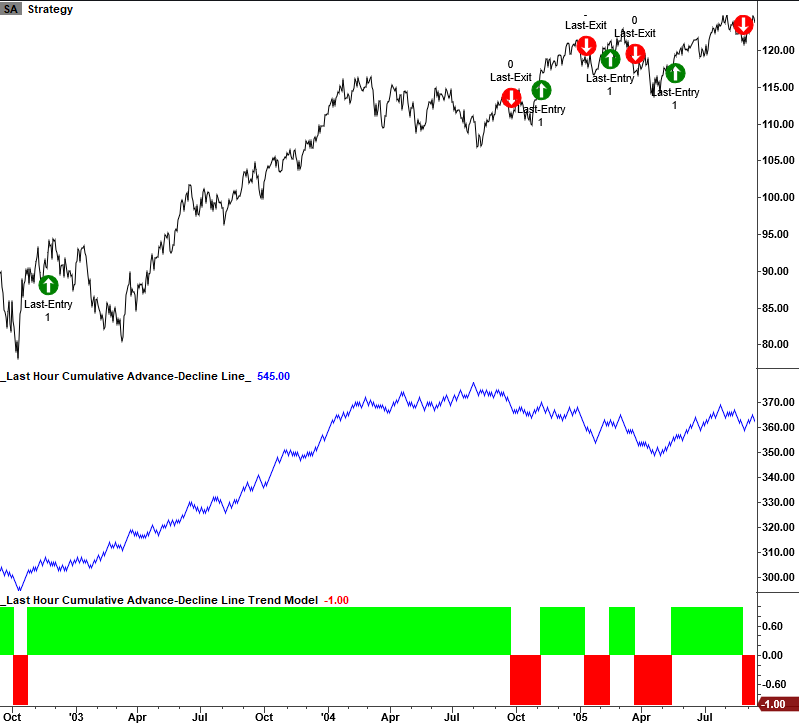
2003-2005 Chart Example
I wanted to share the following example to highlight how this indicator will struggle in a non-trending environment like 2005.
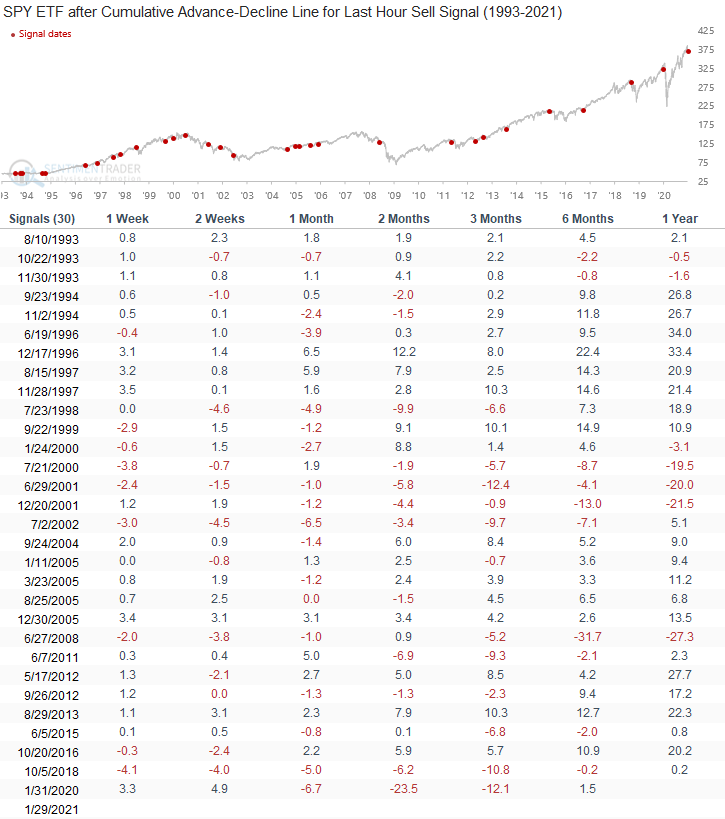
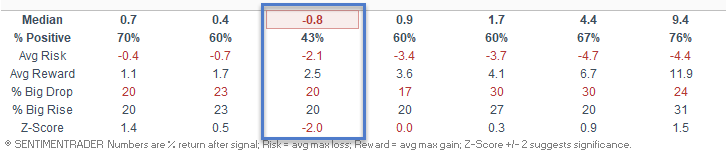
Last Hour Signal Performance after a Sell Signal
As the table below shows, returns are weak in the 1-month timeframe after a sell signal. It's also not uncommon for the market to rally on a short-term basis after a signal, as indicated by the 1-week results. I suspect it's a relief rally from the extreme selling pressure that triggered the sell signal.
Conclusion: Selling pressure in the last hour of trading has been very negative of late. As we all know, the short squeeze in a handful of stocks has created a de-risking event in an environment where sentiment measures are incredibly optimistic. As noted by Jay on Friday, February is one of the weaker months of the year. I would expect some choppy market action.