
A Strategy for When (and if) the "Bubble Bursts"

Two of my objectives here at Sentimentrader are to offer my insight regarding options trading and to help individuals to more effectively "think like a trader." This piece will attempt to do both.
There are basically two camps out there these days:
- The "Tech is King" Camp
- The "Tech is a Bubble" Camp
With technology advancing so quickly these days, it is hard to see anything but a bright future regarding continued massive growth in the technology sector. That is the primary argument of the people in the first camp. At the same time (and as history has shown many times), there come times when there can be a big difference between "a company" and "it's stock." Regardless of how fast any company may be growing, there can come a point where the valuation of the stock reaches an extreme – and unsustainable - level. When that occurs something bad invariably follows for the stock itself. That is the primary argument of the people in the second camp.
The course of action for people in the first camp is pretty straightforward – buy stock. If you think the future is bright then put your money down and get onboard. The course of action for people in the second camp is a bit murkier. Yes, you can sell short shares of stocks that you think are overvalued. But to do so in today's environment can be a lot like strapping yourself to a rocket that you think is about to run out of fuel – a potentially exciting ride, but one fraught with peril.
A bearish trader can also buy put options as a bet on lower prices. But timing is key, put option prices can be pretty costly at the moment on tech stocks trading in the $300 and up range and time decay can be the "monkey on the back."
So, is there a better course of action for "Tech is a Bubble" campers? Possibly. But first a few important caveats:
Nothing that follows is intended to be construed as "investment advice", nor is the highlighted example trade a "recommendation." It is presented merely as one way for a trader who believes that a given stock may collapse to speculate on such an outcome, while at the same time limiting their dollar risk to a reasonably small level. In addition, no opinion one way or the other is being offered as to which "camp" is – or will ultimately – be correct. The following example is for educational purposes only.
Well, that was exhausting. Now on with the example.
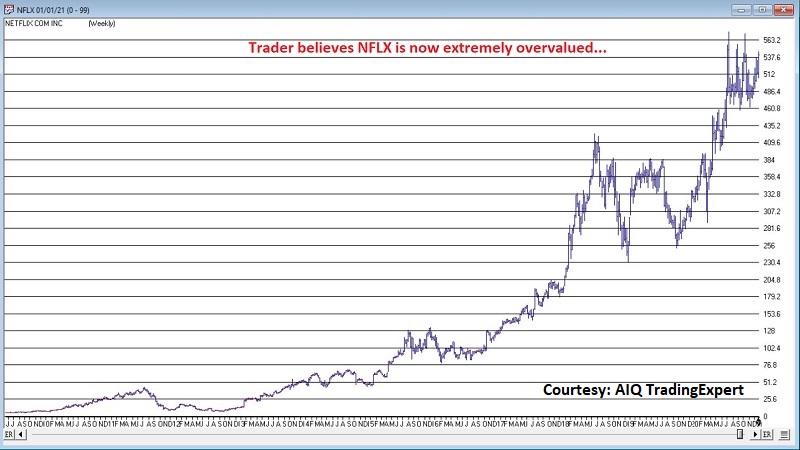
We start our example on December 21st, 2020, looking at Netflix and stems from a trader holding the following hypothetical opinions:
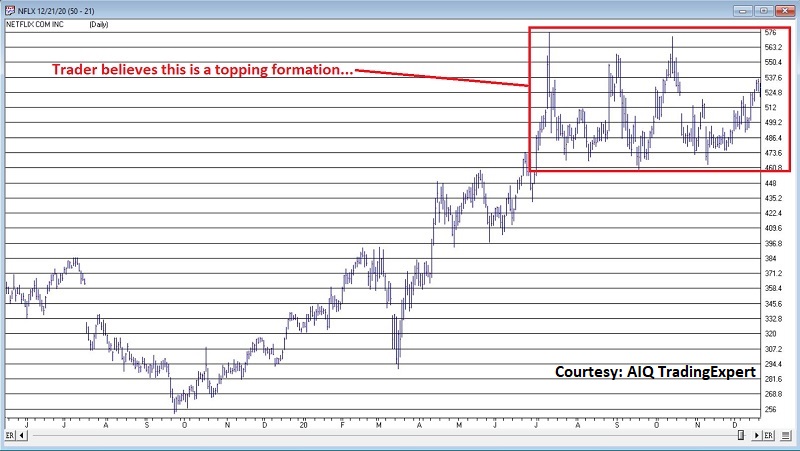
*NFLX is in the midst of a topping formation
*NFLX is overvalued and is due to "crash" at least 50% and maybe much more
*This collapse is expected to occur sometime within the next 7 months
*The trader does not want to risk a lot of money on this scenario and wants to treat it solely as a low-risk, high-reward speculation
The bottom line is that we are approaching this trade as a pure speculation on the possibility that the "bubble might burst" for NFLX sometime within 7 months of the trade being entered. If that does happen, we would like to make a substantial percentage return, but we recognize that mathematically this is a low probability trade. As a result, we only want to take a minimal dollar risk.
The charts below show the trader's assumptions. Again, no suggestion that these assumptions will prove right or wrong should be, well, assumed.
The chart below shows a NFLX stock bar chart along with the average at-the-money implied volatility for NFLX options with greater than 90 days left until expiration.
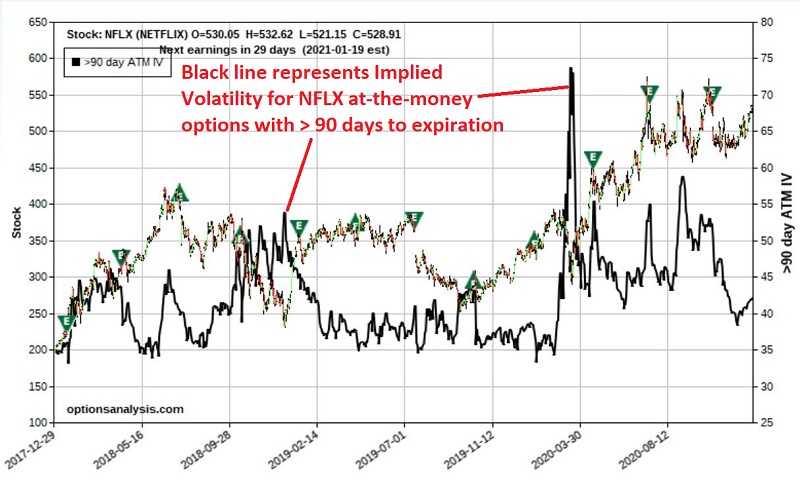
Two things to note here:
- IV tells us whether options are "cheap" (low IV), "expensive" (high IV), or somewhere in between
- As you can see, IV for 90+ day NFLX options is presently about in the middle of the historical range – neither high nor low
High IV tells us that there is a lot of time premium built into the option prices of a given security and low IV tells us that there is little time premium built in.
One more thing to note before we proceed: The better your timing, the better the opportunity. In other words, if your assessment that NFLX is going to collapse is correct, AND the closer to the beginning of that collapse you enter the trade, the better your chances of earning maximum return. For the purposes of this example, we are making no assumptions regarding timing, other than to say we want to profit if NFLX "falls out of the sky" anytime in the next 7 months. As a result, we will in part be looking at July 2021 options on NFLX.
According to a probability calculator a 1-standard deviation move lower by NFLX by 7/16/21 (the date July 2021 options expire) would be to about $395 and a 2-standard deviation move would be to about $294. So, let's consider an example trade that can profit from this type of extreme move, without assuming large dollar risk.
The strategy we will consider might be referred to as a "far out-of-the-money diagonal put calendar spread." Don't go looking for that one in most option textbooks. We are using options creatively here to create a position specifically crafted to profit from a particular scenario.
The trade involves:
- Buying the Jan2022 NFLX 300 put @ $10.88
- Selling the July2021 NFLX 270 put @ $2.83
The particulars appear below. All charts that follow are courtesy of www.OptionsAnalysis.com.
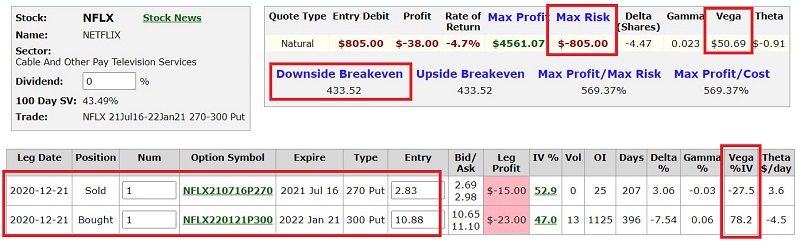
Things to note:
- These are thinly traded options and it is assumed that we got filled by using a limit order to buy and sell at the midpoint of the bid/ask range for both options
- The cost – and maximum risk – is $805. Bottom line, if NFLX resumes an upward trajectory this trade will lose money. But the most it can lose is $805.
- If held until expiration the breakeven price for this trade is $433.52, or roughly 18% below the current price. However, the trade can start becoming profitable at a much higher price if NFLX stock price falls sooner than later (hence the aforementioned importance of timing)
One other important factor to note that we will discuss in more detail later is the fact that the trade has a "Vega" of $50.69. Vega is a Greek options term that tells us how much a position would be expected to gain or lose in dollars, based solely on a one percentage point increase in implied volatility. Since Vega is positive in this case, it tells us that if IV were to rise one percentage point, then the value of this position would increase by $50.69. By extension, if IV rose ten percentage points then the position value would increase by $506.90. Of course, if IV falls instead, the trade can lose this amount of value based solely on the decline in IV. More on this topic later.
The chart below represents the "risk curves" for this trade, and probably requires some explanation.
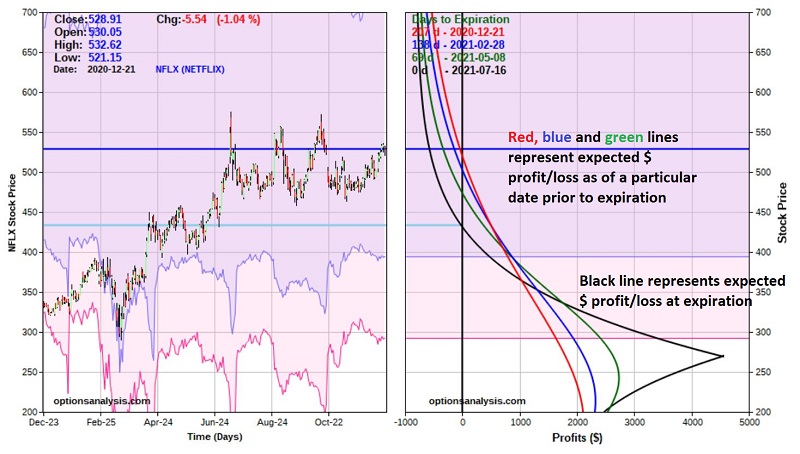
- The price of NFLX stock is listed along the left-hand side of the left-hand rectangle AND the right-hand side of the right rectangle
- The left-hand rectangle displays a bar chart for NFLX
- The previous dates for the bar chart are listed at the bottom of the left-hand graph
- Each colored line in the right-hand rectangle represents the expected dollar profit or loss at any given price for NFLX as of a given date. The red line represents the expected P/L as of today and the black line represents the expected P/L as of option expiration in July.
- The expected dollar gain or loss dollar value is listed along the bottom of the right-hand rectangle
So What Happens Next?
Once the trade is entered, any number of scenarios can play out. In general terms they are:
Scenario #1: NFLX goes up
It is fairly obvious that if NFLX goes up in price (or even stays unchanged) this trade will lose money. The questions that a trader needs to ask and answer (preferably even before entering the trade) is "Will I cut a loss?" and if so "What will cause me to cut a loss?" One example might be to exit the trade if NFLX breaks out above its previous high just north of $575 a share. Under this scenario the expected loss would be somewhere between -$290 and -$690, depending on whether the stop-loss price is hit immediately or seven months from now.
Scenario #2: NFLX goes down some
If NFLX were to begin declining in price soon after the trade is entered this position is capable of generating a significantly high percentage rate-of-return based on as little as a 15-20% price decline. One key price level to note is around the $400 where the blue, green and red lines converge. Above this price time decay works against this trade, i.e., the profit or loss is less at any given price as time goes by. On the other hand, below this price time decay works in favor of this trade, i.e., the level of profit increases as time goes by.
Scenario #3: NFLX goes down a lot
The reason this trade is being considered in the first place is as a bet on the potential for a major selloff by the underlying stock. As NFLX price declines further, the level of profit increases until NFLX reaches the strike price of the option we sold (the July 270 put), at which point the risk curves "roll over." A trader holding this position should make a note that this trade should be exited or adjusted before the risk curve rolls over.
One More Key Factor: Changes in Implied Volatility
As I mentioned before, changes in implied volatility can have a profound effect on certain option trades. A calendar spread typically falls into that category. Let's understand why. As previously explained, Vega tells us how much a given option or option position will rise or fall based on a one percentage point increase in IV. Also, it is important to note that longer-term options have a higher Vega than a shorter-term option at the same strike price.
The other key thing to note is this: Typically – though not always – IV will often tend to "spike" to sharply higher levels when the price of the underlying falls sharply. This is typically due to "fear", as traders rush to buy options to hedge in the face of a falling stock price, thus accelerating demand for options and in turn inflating the amount of time premium that option writers will demand for selling options on a volatile stock.
In the earlier screenshot showing the particulars of this trade we see that:
- The Jan2022 300 put that we hold a long position in has a Vega of $78.20
- The Jul2021 270 put that we hold a short position in has a Vega of -$27.50
As a result, this trade has "positive Vega". So, consider the following potential scenario:
NFLX stock price falls sharply AND option implied volatility simultaneously spikes (as would be expected). Let's say IV rises by a factor of 1.3 (i.e., 30%) from its current level. The resulting risk curves appear in the chart below.
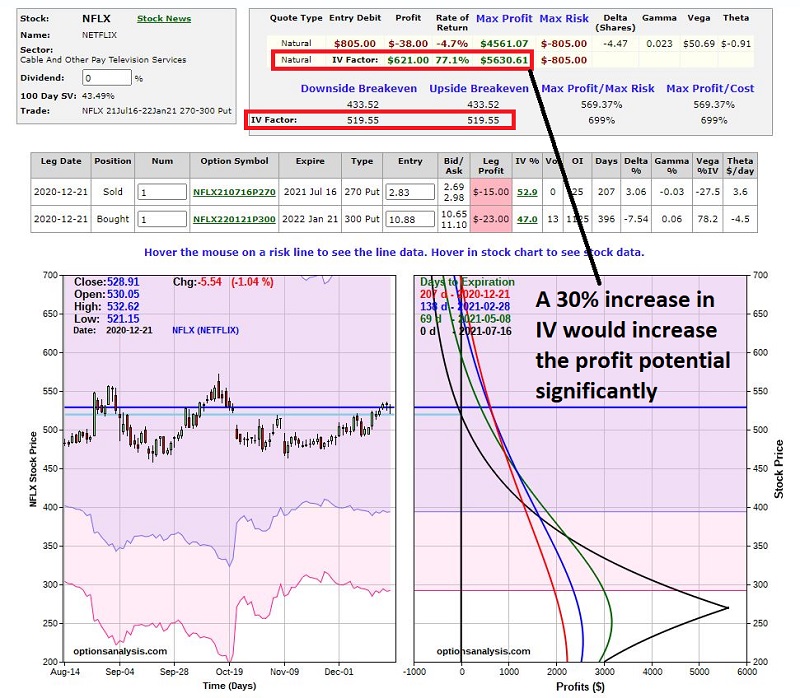
As you can see, a 30% increase in Vega would increase the value of this position by $621, and as a result all of the risk curves are elevated (i.e., profit potential increases). It should be noted that Vega values (and all Greek values) change over time and that the $621 figure is based on the status of the position as of 12/21/20. Still, the bottom line is this: If NFLX declines sharply in price then implied option volatility is likely to increase – possibly by a substantial amount, thus inflating the profit potential for this trade beyond what was anticipated when the trade was entered.
Summary
There is a lot to chew on here. Once again, I am in no way suggesting that NFLX (or any other stock) is going to behave in any particular manner. The purpose of this piece is simply to alert you to a relatively low dollar-risk strategy for speculating on a large decline in the price of a security – as well as the "ins and outs" of understanding the factors that can affect this trade after it is entered.