
A tale of two S&P's

We've seen how a few stocks have been taking over the market which has masked some underlying weakness in indexes. While the Advance/Decline Line has broken out to a new high, that doesn't mean the gains are evenly spread, not even remotely. The stocks-only A/D Line still remains below its prior high.
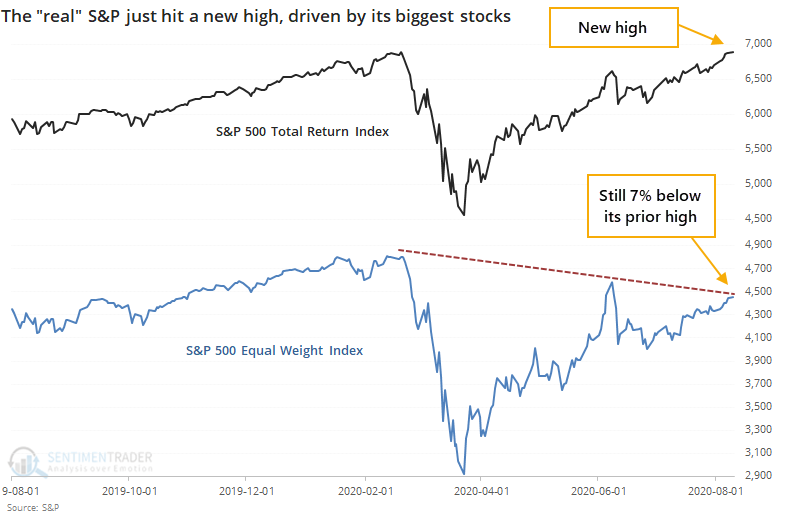
These quirks have allowed the S&P 500's Total Return index to close at a new all-time high. This is the version of the index that takes dividends into account, which is what a "real" investor would receive. Yet the Equal Weight version of the index, which puts all 500+ stocks on equal footing, is still more than 7% below its own high, even though its relative performance has picked up in recent days.
Over the past 30 years, there have only been four other days when this kind of quirk triggered. Even when relaxing the parameters to look for a 5% divergence, only a handful more days showed up, mostly around the same time frames. Stocks did not do well after those days, especially the capitalization-weighted version of the S&P 500.
This is an abridged version of our recent reports and notes. For immediate access with no obligation, sign up for a 30-day free trial now.
We also looked at:
- What happened to each version of the S&P after similar divergences
- SPY is extremely stretched versus its Volume-Weighted Average Price (VWAP)
- The Nasdaq's 3-day losing streak
- The Dow Transports have had a heck of a two-week run
- There was a huge drop in gold sentiment