
A Time for Caution in Soybeans

I wrote about potential trouble for corn in this piece on 6/15. Today we focus on soybeans.
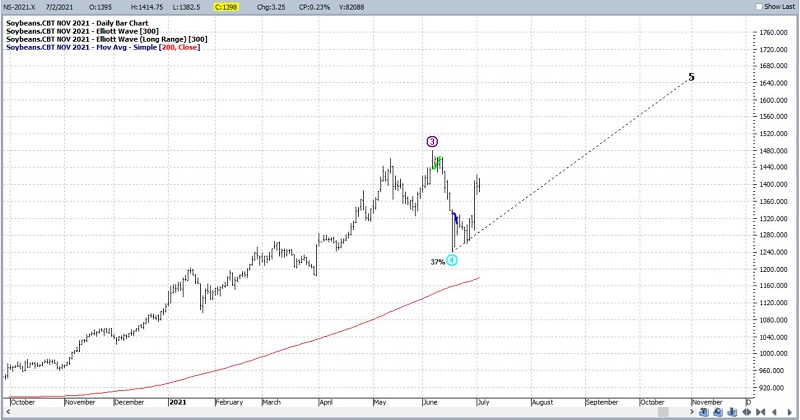
Let's start with the good news. The chart below (courtesy of ProfitSource) shows that the November soybean futures contract is in an established uptrend above a rising 200-day moving average. Also, the Elliott Wave algorithm built into ProfitSource is projecting higher highs in the months ahead for beans for what it is worth.
Like I said, that's the good news. But there are other reasons to maybe not pile into the long side of beans at the moment.
DAILY PRICE ACTION
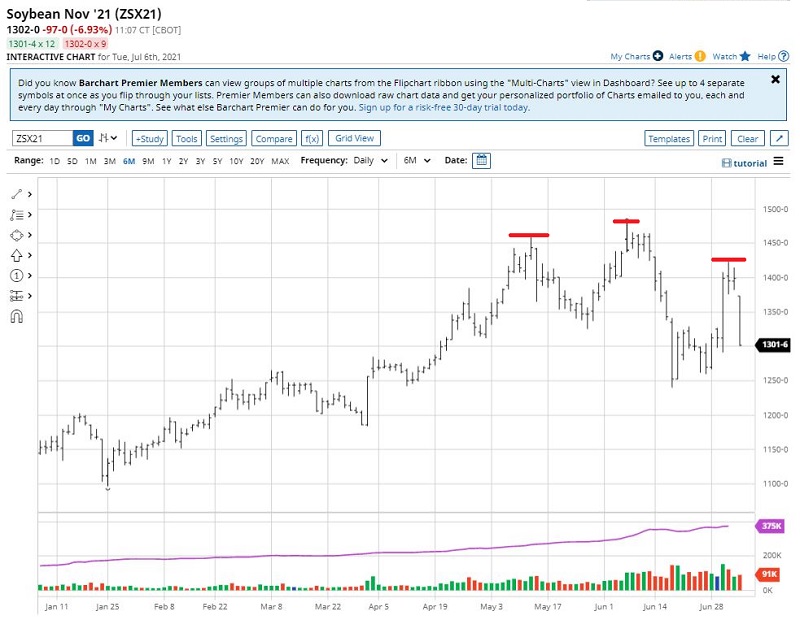
The chart below (courtesy: Barchart.com) displays a daily bar chart for November 2021 soybean futures. Some traders may see a potential head-and-shoulders pattern forming. If nothing else, price tried hard to rally last week and that rally has failed to follow through. Prices are collapsing in the short term.
DIVERGING INDICATORS
The chart below displays November beans with the MACD and Stochastic indicators displayed in the lower clips.
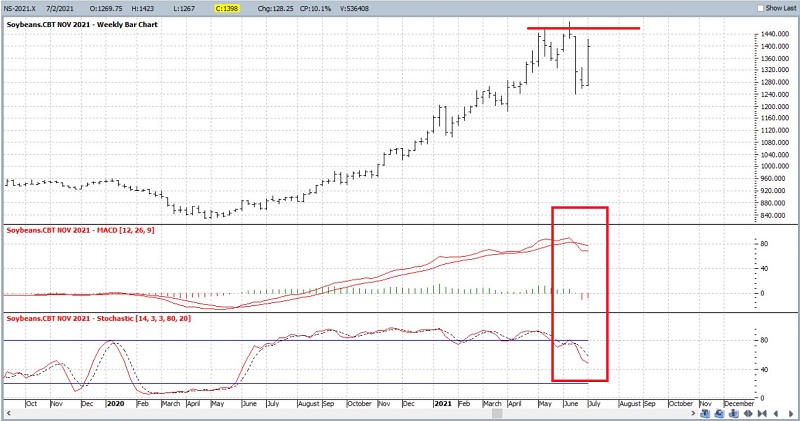
Note that both MACD and Stochastics have rolled over and are trending lower even as price tried to rally.
So, traders must ask the questions:
- Do I go with the trend (as shown in the first chart)?
- Or do I fade the trend or simply stand aside (as hinted by the second chart)?
These are questions that can only be answered definitely in hindsight. But let's add one more factor to the "weight of the evidence."
THE ELEPHANT IN THE ROOM: SEASONALITY
The chart below displays the Annual Seasonal Trend for soybeans.
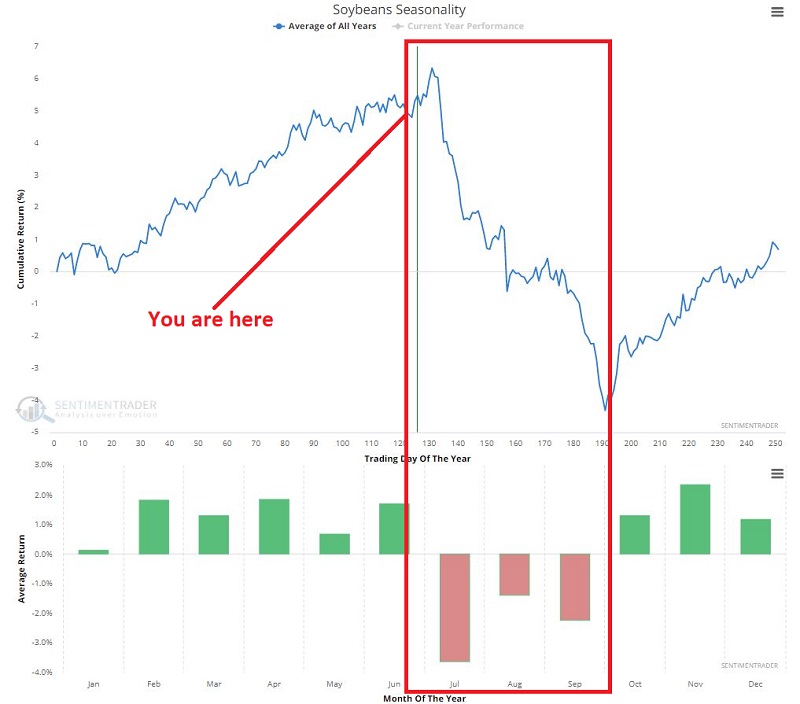
The implications in the chart above are pretty straightforward. July has historically been the worst month for beans, and in fact, July, August, AND September have all showed historical weakness.
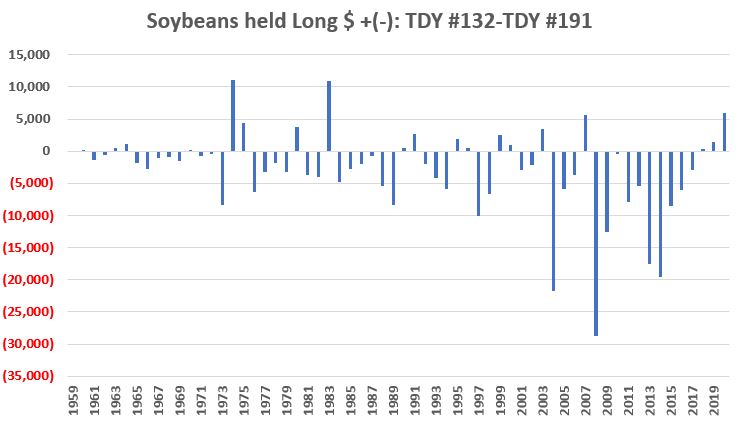
The chart below displays the annual $ gain or loss for soybean futures:
- Only during Trading Day of the Year #132 through #191
- Every year since 1959
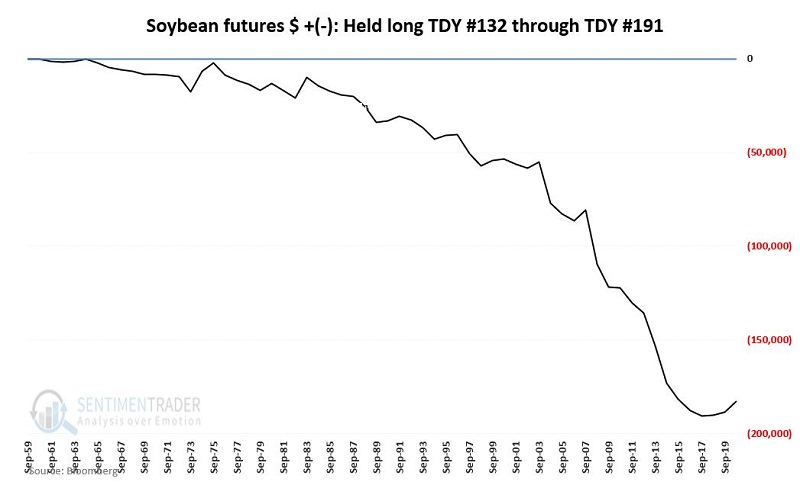
The chart below presents the cumulative results from the chart above.
For the record, beans showed:
- a gain 19 times (31% of the time)\
- a gain 43 times (69% of the time)
- a median gain of +$1,938
- a median loss of -$3,625
SUMMARY
There is no reason soybeans cannot continue their current trend and move higher in the months ahead. But for a trader looking to put the odds on their side, it should be noted that we are entering a period when seasonal headwinds can offer a formidable opposing force. In the worst case, if the normal seasonal trend asserts itself, the current decline could be merely a prelude of things to come.
Traders looking to play the short side of beans should keep a close eye out for a peak in the seasonal soybean chart.