
A Time to Steer Clear of Ford

I want to make an important point right at the outset. Please do NOT mistake this as an article about market timing or about when to buy and sell the stock of Ford Motor Company.
In reality, this is actually an article about the importance of how you allocate capital. To wit:
Jay's Trading Maxim #47: You cannot control price action once you enter a position. The only thing you can control is how much you have allocated and how much you risk.
Jay's Trading Maxim #48: One of the keys to long-term success is putting the odds on your side as much as possible, trade after trade after trade.
FORD BY THE MONTH
The table below displays the cumulative % return for Ford stock (ticker F) each month between 7/31/1972 and 7/31/2021, i.e., 49 years.
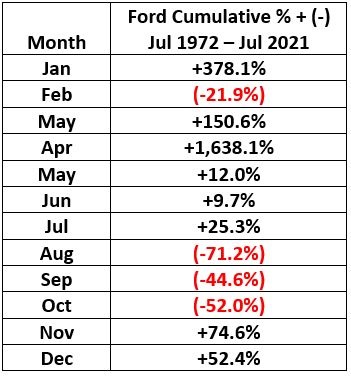
Does anything at all jump out at you in the table above? If your eyesight is functioning even marginally well, chances are it took you about 4/10ths of a second to notice that August, September, and October have all shown devastatingly negative results over the past 5 decades.
To spell it out in all of its dismal glory:
- A long position held in Ford stock
- ONLY during August, September, and October
- Every year since 1972
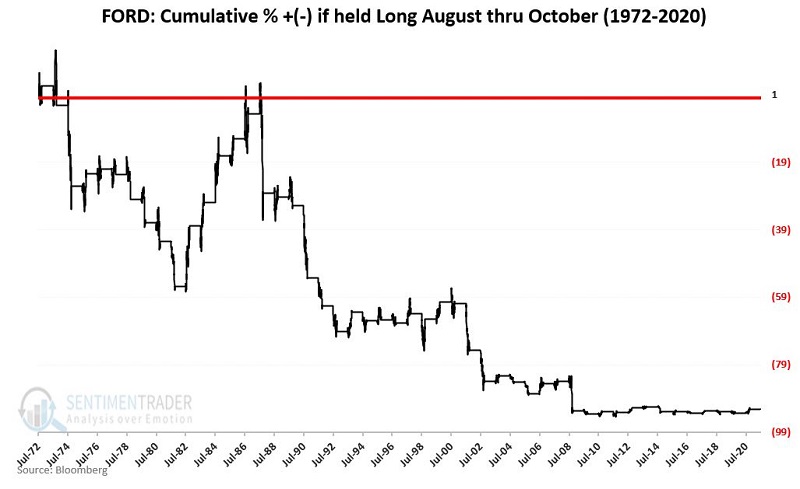
- Has lost -92.3% of its value
To put it another way, if you started in 1972 with $1,000 and pursued the strategy above, today, you would have roughly $77 left. And no, none of the above is a misprint.
The chart below displays the cumulative hypothetical return achieved by holding Ford stock ONLY during August, September, and October since 1972. The squeamish may wish to avert their eyes.
WHAT THIS DOES NOT MEAN
Now by this time, a certain percentage of readers are likely thinking, "Hey, I can just sell short Ford stock three months of every year and make a lot of money." Yeah, about that. Here is where things get interesting. The table below displays the year-by-year cumulative August through October return for Ford.
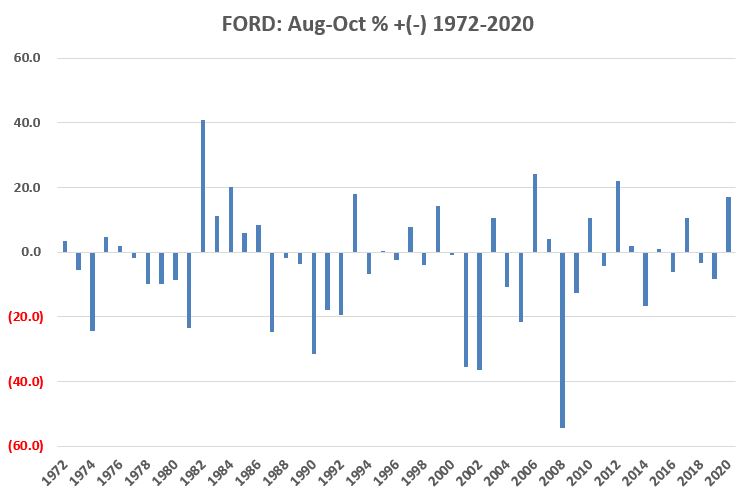
Please note that in 1982, Ford gained +40.9% during August through October. In 2006 it gained +24.1%, in 2012 +22% and 1984 +20.3%. In other words, despite clearly negative long-term results, the reality is that in any given year, ticker F is more than capable of powering higher during this purportedly "unfavorable" period.
In fact:
- In 21 out of the 49 years (or 43% of the time, Ford showed a gain during this purportedly awful period)
- In those 21 years, the average gain was +11.4%
- During the 48 "down Aug-Oct" years, the average loss of -14.5% (with 8 years showing a 3-month loss over -20%)
So, to state that "August through October is bearish for Ford" is perhaps technically correct (I mean -92.3% is -92.3%), but it should in no way be taken as a blanket statement.
WHAT THIS DOES MEAN
At the outset, you may recall that this article is NOT about market timing but rather about asset allocation. So, consider for one moment your answer to the following rhetorical question:
- Do you think Ford is poised to advance in price in the months ahead?
If you follow any number of technical and/or fundamental indicators, your answer to this question may very well be "yes" (or at least "maybe").
But note that the question above is a far different question than this one:
- Does Ford stock seem like a good place to allocate capital now, given what you now know about August through October?
One of the keys to trading success is allocating capital to situations with the highest probability of success.
Can Ford advance in price between now and October 31st? Absolutely.
But does investing right this moment in Ford seem like a "great opportunity," i.e., one with a high probability of success? That is an entirely different question.
And it is a question that each investor/trader must answer for themselves.