AAII Bull Bear Update

The genesis of this article comes directly from information published in this article written by Bespoke Investment Group, so let's give credit where credit is due.
Each week AAII reports the percentage of their members who claim to be either "bullish" or "bearish". The difference between the two is referred to as the "AAII Bull-Bear Spread." For example, if:
- AAII Bulls = 40%
- AAII Bears = 35%
Then
- AAII Bull-Bear Spread = 5%
This spread can jump around a lot from week-to-week. What we are going to look for specifically is this:
- The AAII Bull-Bear Spread increases this week by 15 or more percentage points from last week
- For the first time in the latest 12 weeks
For example, if last week the spread stood at 2% and this week it jumps to 17% or higher - and there was no similar jump during the previous 12 weeks - then a new "bull alert" signal occurs.
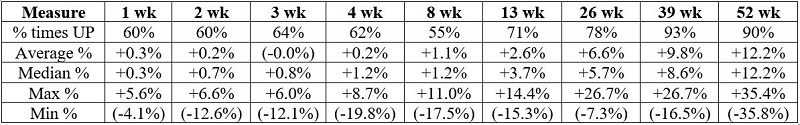
The table below shows the combined results following all instances since 1987. While shorter-term results were mixed, the S&P 500 Index showed a gain over 90% of the time 39 and 52 weeks later. This sets up an interesting alternative play that we will get to a little later.
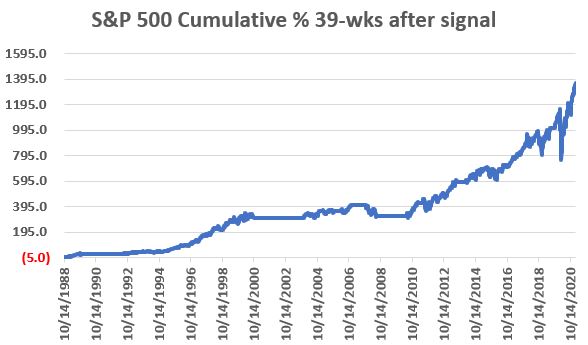
Figure 2 displays the cumulative % hypothetical price gain achieved by from holding the S&P 500 Index for 39 weeks after each new signal (Technical Note: the AAII numbers are typically reported on Wednesday, but our results assume a trade is entered or exited at the close of trading for the week, i.e., Friday's close unless Friday is a holiday, then Thursday's close is used).
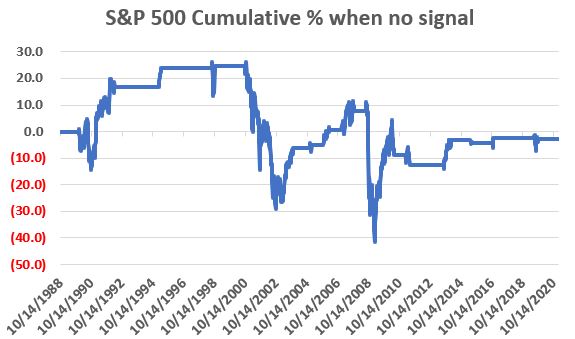
The chart below displays the cumulative % price return for the S&P 500 Index ONLY when a bullish signal is NOT in force. The bottom line is that not much of anything positive typically happens during these "lulls."
One Alternative Play
For the next test, we employ the following rules:
- The AAII Bull-Bear Spread increases this week by 15 or more percentage points
- For the first time in the latest 12 weeks
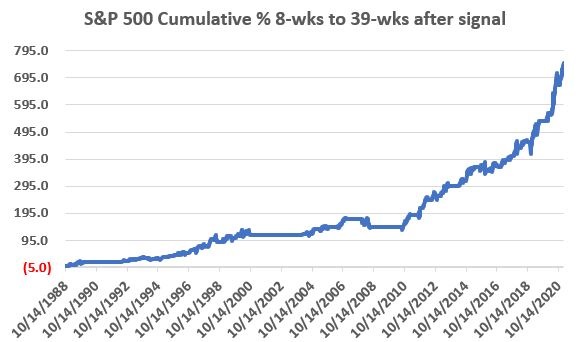
- Wait 8 weeks then buy the S&P 500 Index
- Hold a long position in the S&P 500 Index for 31 weeks
The chart below displays the results for this test. The key thing to note is the lack of significant drawdowns.