
Absolute & Relative Trend Update

The goal of today's note is to provide you with some insight into what I am seeing with my absolute and relative trend following indicators for domestic and international ETFs.
Data as of 7/9/21 close. All relative comparisons are versus the S&P 500 ETF (SPY). For absolute and relative indicator definitions, please scroll down to the end of the note.
I added the consecutive days above or below the 10-day moving average count to the indicator tables. Please click here for a trading signal based on the moving average trend count concept.
ABSOLUTE & RELATIVE TRENDS - SECTOR ETFS
The technology and consumer discretionary sectors registered multiple relative highs last week. In particular, the breakout in AMZN propelled the discretionary group. Short-term price momentum in technology remains strong, with the sector closing above its 10-day moving average for 25 consecutive days.
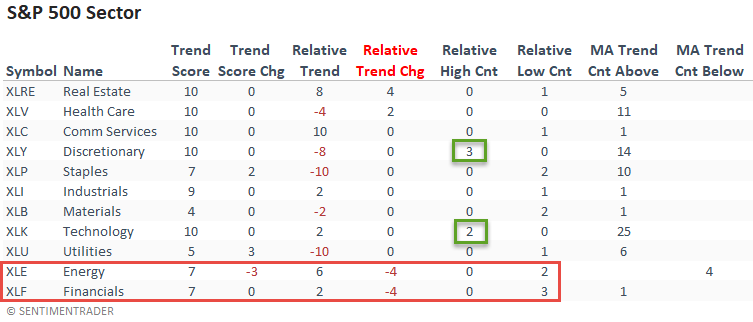
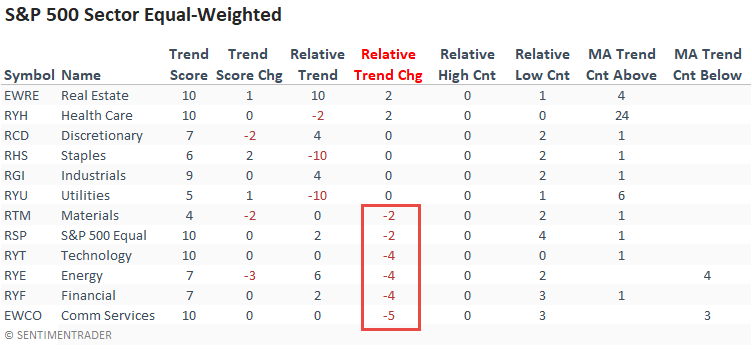
Interestingly, the equal-weighted data from the technology and consumer discretionary sectors did not confirm the trends in the cap-weighted versions. Neither sector registered a new relative high, and technology even showed a decline in its relative trend score. While overall market leadership has been narrow of late, we're now seeing it at the sector level within technology.
The small caps continue to deteriorate on an absolute and relative basis. I would also note that every single sector registered multiple relative lows last week.
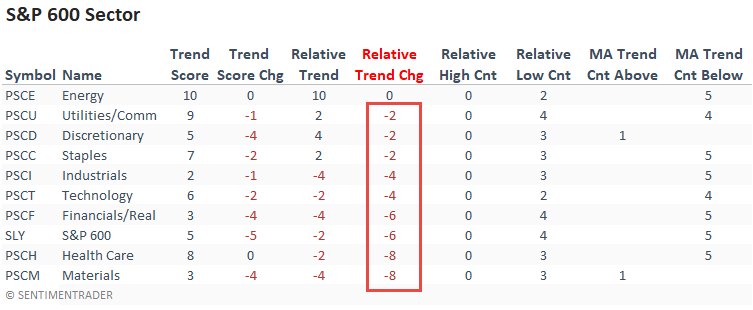
CHART IN FOCUS
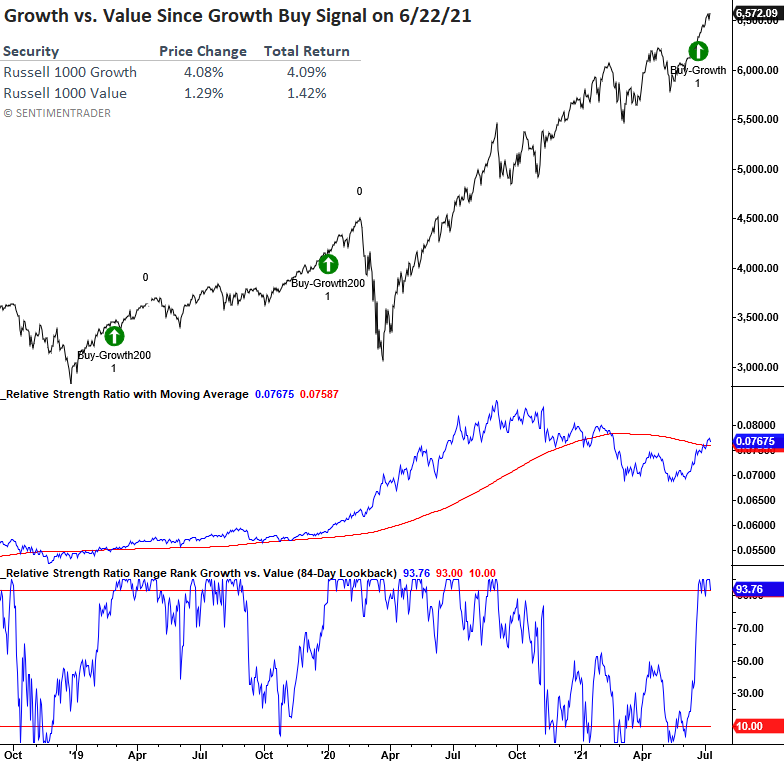
Let's look at the growth versus value relative ratio range signal that we shared in a note on 6/24/21. As the chart/table shows, growth stocks are comfortably outperforming value. I would also add that growth stocks registered a new relative high versus value stocks on 3/4 days last week.
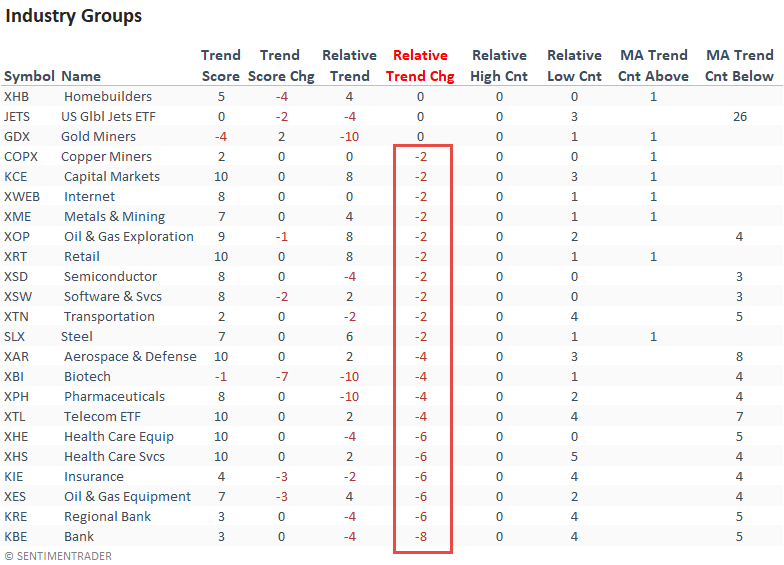
ABSOLUTE & RELATIVE TRENDS - INDUSTRIES
The relative trend change column shows significantly more industries with a deteriorating relative trend score versus an improving one. And, if we compare relative highs to relative lows, we see that lows are outpacing highs by a significant amount.
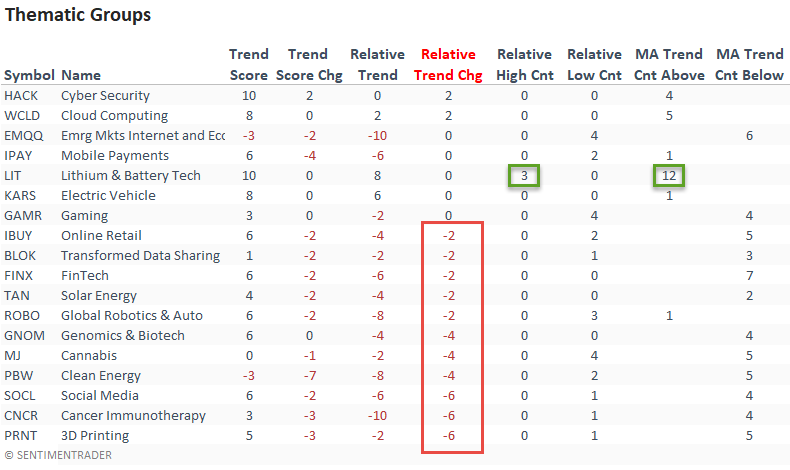
ABSOLUTE & RELATIVE TRENDS - THEMATIC ETFS
The thematic groups also show more deteriorating versus improving relative trend scores on a w/w basis. The Lithium and Battery technology ETF had a solid week as it registered a new relative high on 3/4 days.
With growth having a solid week versus value, it's interesting to see the deterioration in the thematic groups, which lean more toward the growth style. The worsening of trends emphasizes some of my previous points. The market is narrow and being lifted by mega-cap stocks.
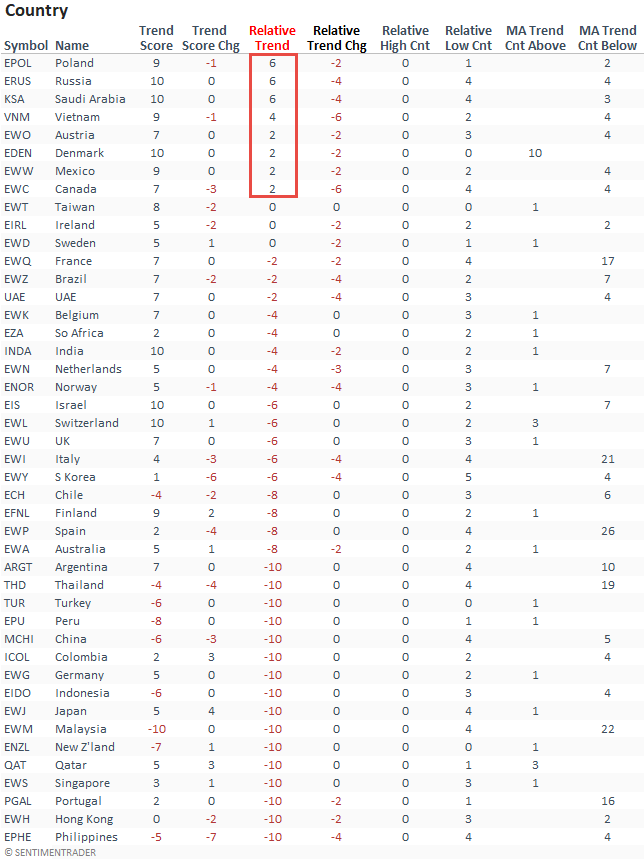
ABSOLUTE & RELATIVE TRENDS - COUNTRIES
Suppose I sort the Country table by the relative trend score column. In that case, it shows only eight countries with a favorable relative trend profile versus the S&P 500. And, I would note that the number of countries with a relative trend score of -10 continues to expand. The severe underperformance trends versus the S&P 500 in the U.S. are just as prevalent worldwide.
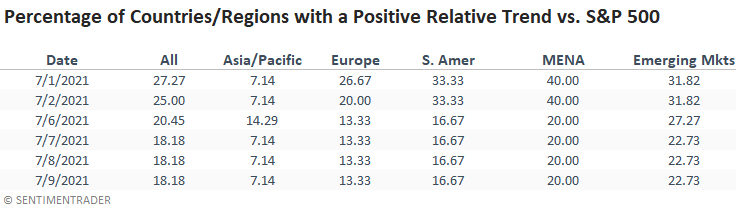
GLOBAL RELATIVE TRENDS
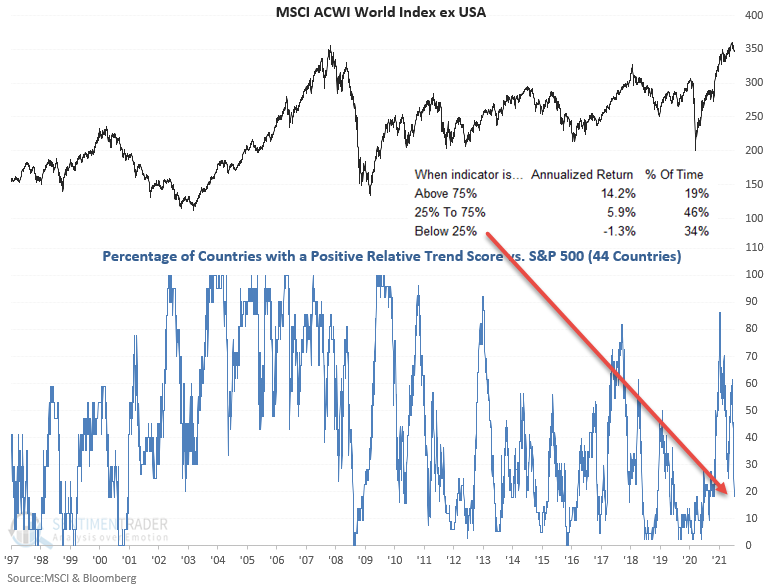
The percentage of countries with a positive relative trend score versus the S&P 500 decreased to a level that suggests negative returns for regions around the globe.
ALL COUNTRY RELATIVE TREND CHART
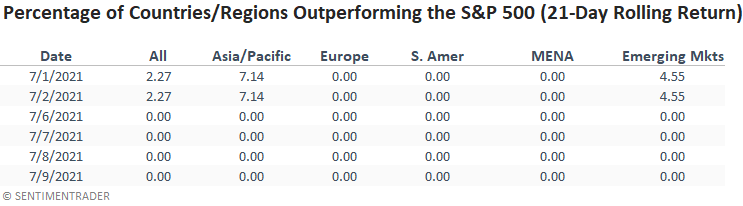
In a note last week, I shared a study that assessed the forward return outlook for stocks when the percentage of countries outperforming the S&P 500 on a rolling 21-day basis falls to a low level. Here's a snapshot of the indicator broken down by worldwide regions.
ABSOLUTE AND RELATIVE TREND COLUMN DEFINITIONS
- Absolute Trend Count Score - The absolute trend model contains ten indicators to assess absolute trends across several durations.
- Absolute Trend 5-Day Change - This indicator measures the 5-day net change in the absolute trend model.
- Relative Trend Count Score - The relative trend model contains ten indicators to assess relative trends vs. the S&P across durations.
- Relative Trend 5-Day Change - This indicator measures the 5-day net change in the relative trend model.
- Relative High Count - This indicator measures the number of 21-day relative highs vs. the S&P 500 in the last 5 days.
- Relative Low Count - This indicator measures the number of 21-day relative lows vs. the S&P 500 in the last 5 days.
- Absolute and Relative Trend Scores range from 10 (Best) to -10 (Worst)
- MA Trend Cnt Above - This indicator counts the number of consecutive days above the 10-day moving average.
- MA Trend Cnt Below - This indicator counts the number of consecutive days below the 10-day moving average.