
Absolute & Relative Trend Update

The goal of today's note is to provide you with some insight into what I am seeing with my absolute and relative trend following indicators for domestic and international ETFs.
Data as of 10/15/21 close. All relative comparisons are versus the S&P 500 ETF (SPY). For absolute and relative indicator definitions, please scroll down to the end of the note.
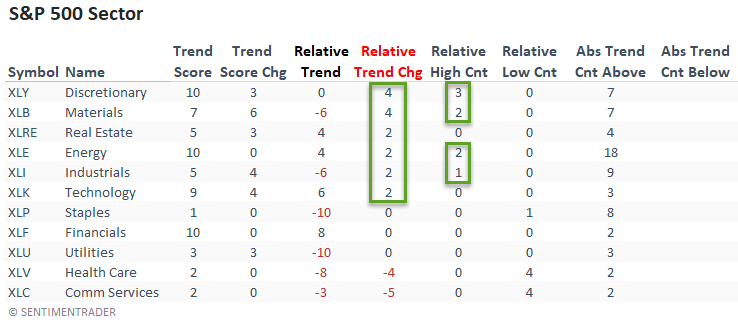
ABSOLUTE & RELATIVE TRENDS - SECTOR ETFS
The relative trend score change column shows that sectors with a more offensive tilt improved as the broad market bounced in the latter half of the week.
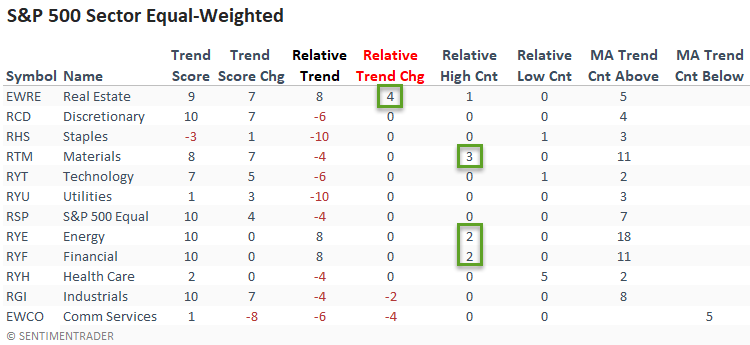
The equal-weighted sector data shows a clear distinction from the cap-weighted data. Besides real estate, not a single other group improved on a relative basis. It would appear that mega-cap companies drove the relative trend score gains in the cap-weighted data. However, I would note that materials, energy, and financials registered several new relative highs.
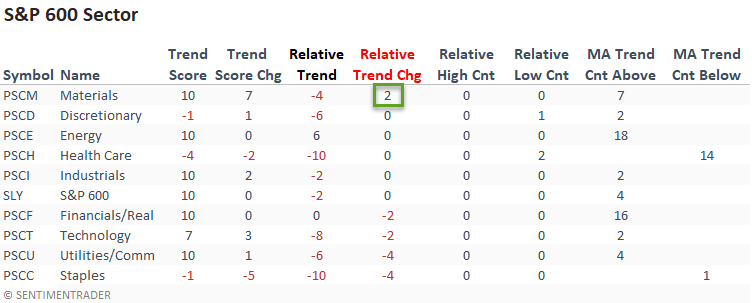
Small-cap stocks show a similar pattern to the large-cap equal-weighted data. Besides materials, no other sectors improved on a relative trend score basis. And, not a single group registered a new relative high versus the S&P 500.
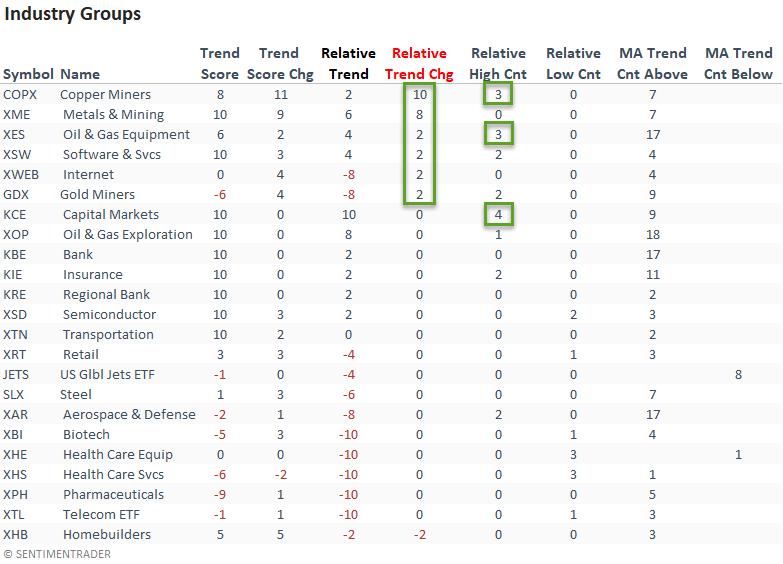
ABSOLUTE & RELATIVE TRENDS - INDUSTRIES
Suppose you sort the industry table according to the relative trend change. In that case, we see improvement from mostly resource-based industries. The absolute and relative trend scores for the copper miners' ETF showed significant improvement on the back of a strong move in the underlying commodity.
The capital markets ETF continues to look solid, and I would note that it registered a new relative high on 4/5 days last week.
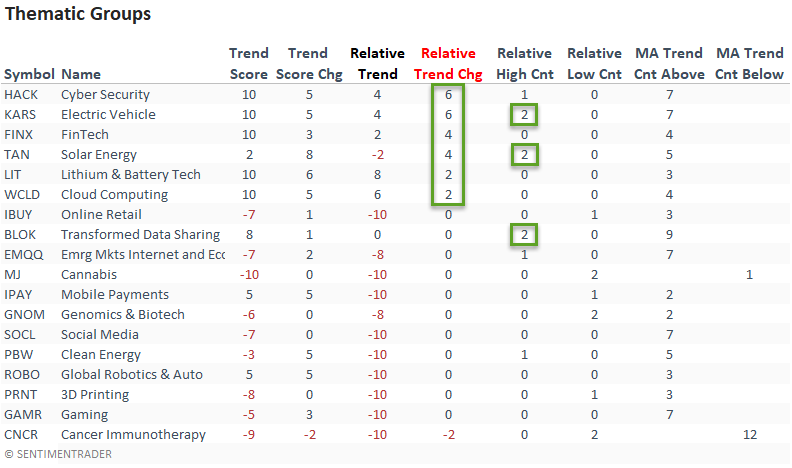
ABSOLUTE & RELATIVE TRENDS - THEMATIC ETFS
Suppose you sort the thematic ETF table according to the relative trend change column. In that case, we see relative trend score gains from some of the better performing thematic groups.
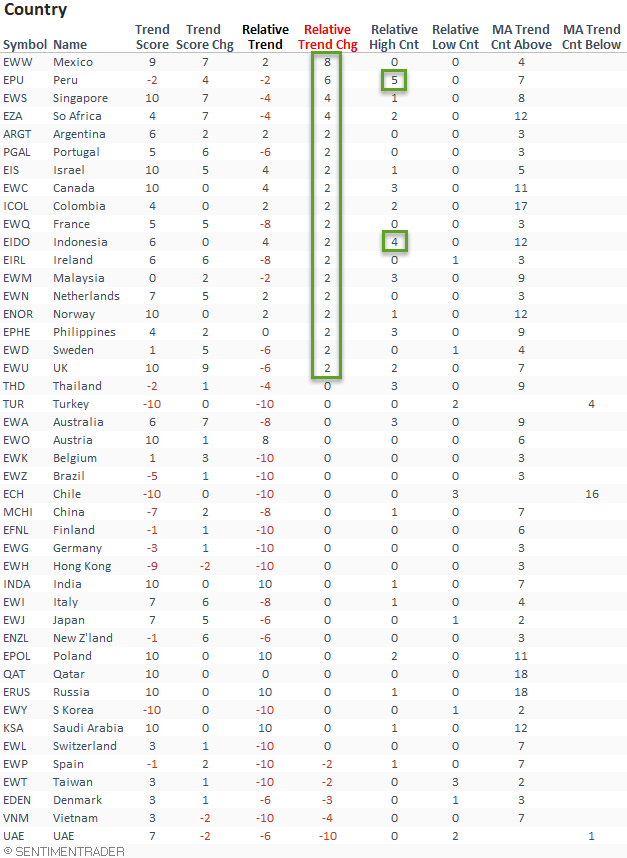
ABSOLUTE & RELATIVE TRENDS - COUNTRIES
Suppose I sort the Country table by the relative trend score change column. In that case, it shows improvement from a significant number of countries, especially Mexico and Peru. And, I would note that Peru registered a new relative high on all five days last week.
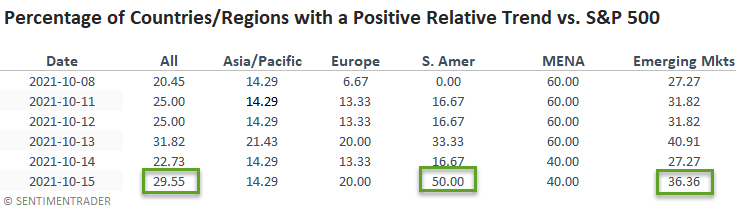
GLOBAL RELATIVE TRENDS
The percentage of countries with a positive relative trend score versus the S&P 500 improved on a w/w basis. If we look at the regional data, we see that Europe and South America improved. At the same time, the Asia Pacific region held steady.
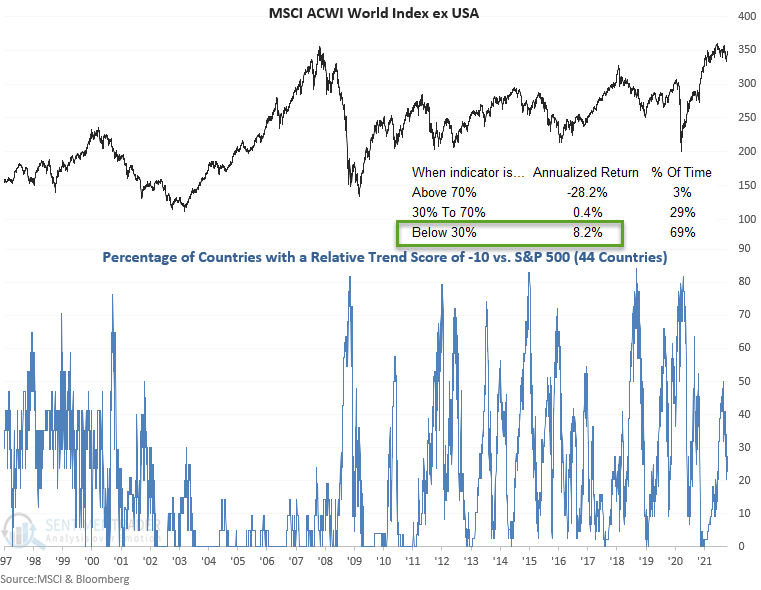
The current all-country data continues to suggest an unfavorable environment for the MSCI ACWI World Index ex USA.
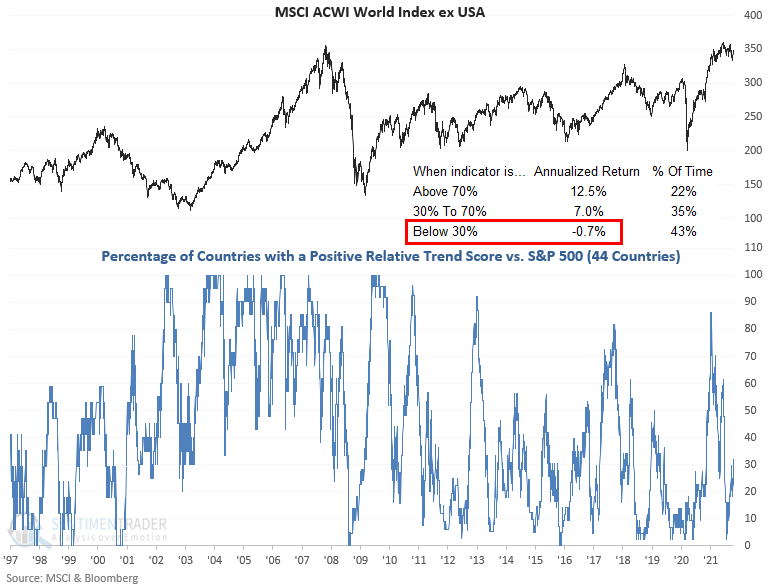
ALL COUNTRY RELATIVE TREND CHART
The percentage of countries with a relative trend score of -10 versus the S&P 500 was unchanged on a w/w basis. The Asia Pacific region deteriorated while Europe improved. If you were wondering about the Asia Pacific region, Taiwan and Vietnam returned to a -10 relative trend score.
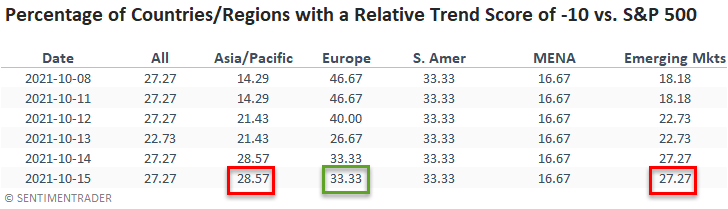
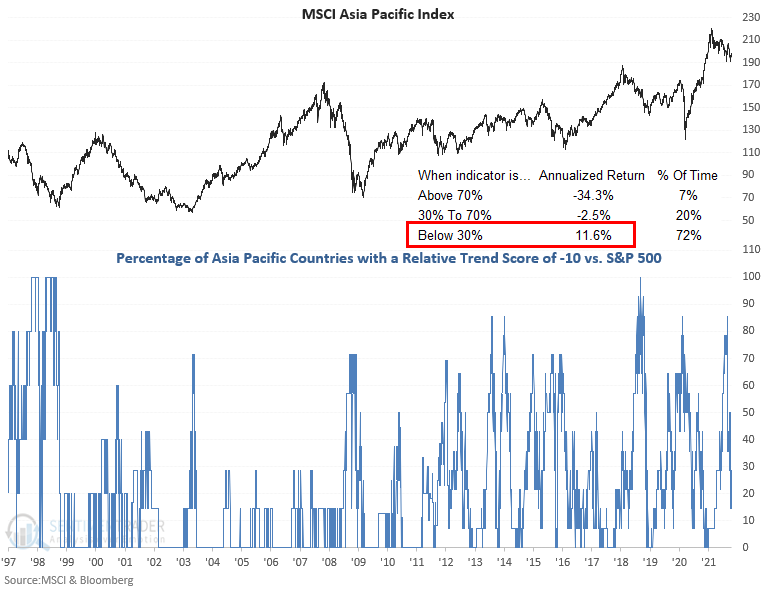
The percentage of countries in the Asia Pacific region with a relative trend score of -10 increased on a w/w basis. However, the data stayed at a level that is more favorable for the region. I think this is a must-watch indicator on a go-forward basis as the supply chain and shipping bottlenecks impact economies around the globe.
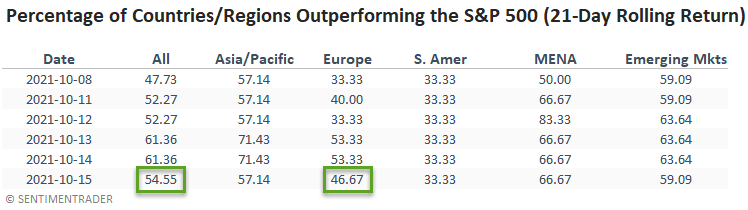
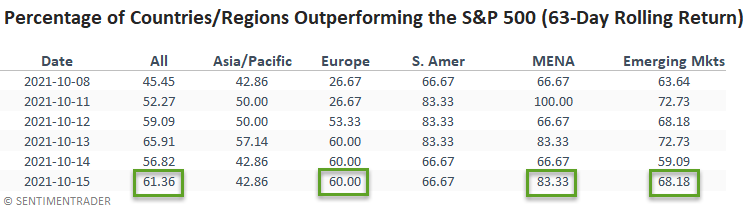
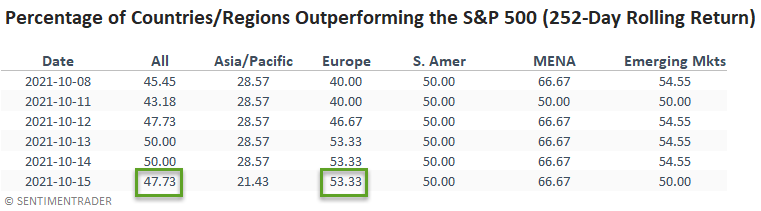
In a note on 7/7/21, I shared a study that assessed the forward return outlook for stocks when the percentage of countries outperforming the S&P 500 on a rolling 21-day basis falls to a low level. I've included a snapshot of the indicator from the original study and two additional tables with different rolling periods.
GLOBAL BREADTH
Global participation amongst USD-based country ETFs is improving. Please see the following note for a mean reversion opportunity in emerging markets. Click here.
ABSOLUTE AND RELATIVE TREND COLUMN DEFINITIONS
- Absolute Trend Count Score - The absolute trend model contains ten indicators to assess absolute trends across several durations.
- Absolute Trend 5-Day Change - This indicator measures the 5-day net change in the absolute trend model.
- Relative Trend Count Score - The relative trend model contains ten indicators to assess relative trends vs. the S&P across durations.
- Relative Trend 5-Day Change - This indicator measures the 5-day net change in the relative trend model.
- Relative High Count - This indicator measures the number of 21-day relative highs vs. the S&P 500 in the last 5 days.
- Relative Low Count - This indicator measures the number of 21-day relative lows vs. the S&P 500 in the last 5 days.
- Absolute and Relative Trend Scores range from 10 (Best) to -10 (Worst)
- MA Trend Cnt Above - This indicator counts the number of consecutive days above the 10-day moving average.
- MA Trend Cnt Below - This indicator counts the number of consecutive days below the 10-day moving average.
Please click here for a note with details on the construction of the composite trend model.