
Absolute & Relative Trend Update

The goal of today's note is to provide you with some insight into what I am seeing with my absolute and relative trend following indicators for domestic and international ETFs.
Data as of 7/16/21 close. All relative comparisons are versus the S&P 500 ETF (SPY). For absolute and relative indicator definitions, please scroll down to the end of the note.
I added the consecutive days above or below the 10-day moving average count to the indicator tables. Please click here for a trading signal based on the moving average trend count concept.
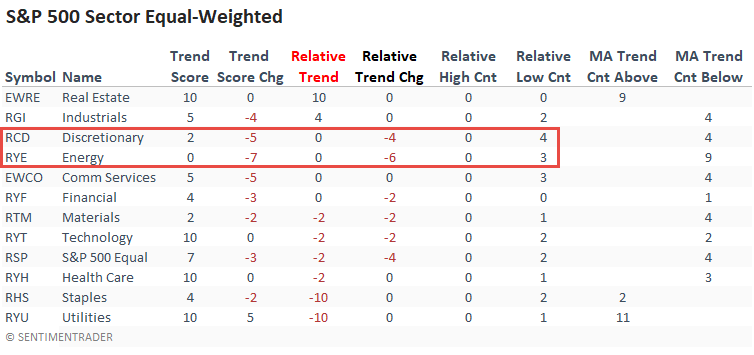
ABSOLUTE & RELATIVE TRENDS - SECTOR ETFS
The relative trend score for the energy sector declined by eight points on a w/w basis, and the group registered a new relative low on 3/5 days. In a note on Thursday and Friday, I shared two studies that suggested one should maintain a cautious outlook for the energy group in the near term.
Real estate looks solid as it holds a perfect absolute and relative trend score.

The relative trend change for the equal-weighted energy sector confirmed the deterioration in the cap-weighted version, albeit the decline wasn't as severe. I would also note that the equal-weighted real estate sector looks just as solid as the cap-weighted version. Let's turn our attention to the relative low column. You may notice that the consumer discretionary sector registered a new relative low on 4/5 days last week as the cap-weighted version had none. As we've stated in several notes, the average stock is not keeping up with cap-weighted benchmarks.
I continue to wonder what the economically sensitive small-cap stocks are trying to tell us as the trends across several indicators look troubling.
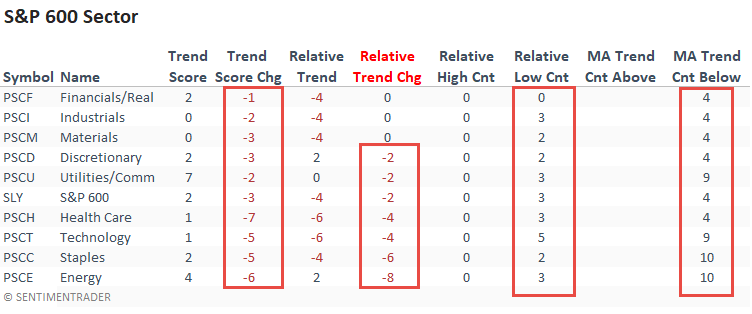
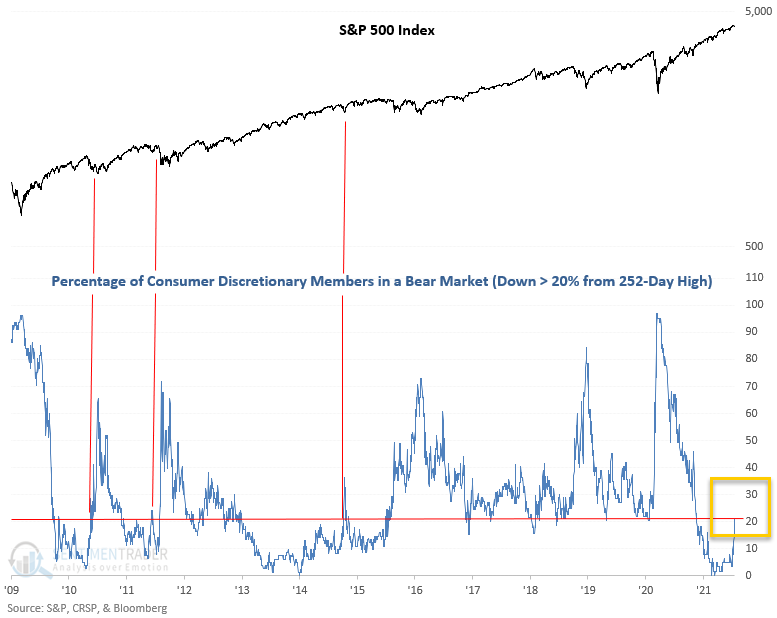
CHART IN FOCUS - STOCKS IN A BEAR MARKET
The percentage of S&P 500 consumer discretionary members trading down 20% or more from a rolling 252-day high crossed above 20% on 7/16/21. Starting in 2009, previous moves above 20% from a low starting point have all come within the context of a market correction. Given that the S&P 500 is only four days and less than 1.5% from its most recent high, this is very unusual.
In case you were wondering, the list contains several airlines, cruise lines, and hotels.
ABSOLUTE & RELATIVE TRENDS - INDUSTRIES
The relative trend change column shows significantly more industries with a deteriorating relative trend score versus an improving one. And, if we compare relative highs to relative lows, we see that highs are nonexistent as lows are plentiful. Finally, the moving average trend count indicator shows that short-term price momentum has turned negative across all industries.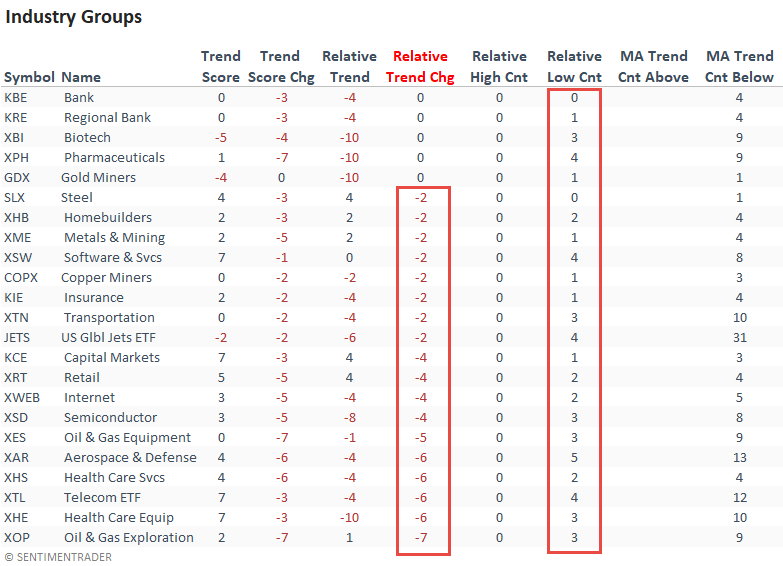
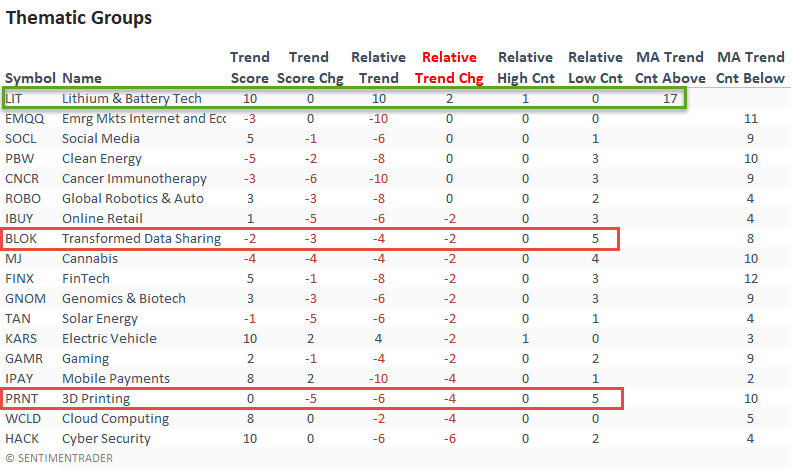
ABSOLUTE & RELATIVE TRENDS - THEMATIC ETFS
The Lithium and Battery Technology ETF maintains a perfect absolute and relative trend score. And, short-term price momentum remains strong as the ETF has traded above its 10-day moving average for 17 consecutive days.
As was the case with the industry table, the absolute and relative scores for thematic groups are deteriorating, and new relative lows outnumber new relative highs in a meaningful way.
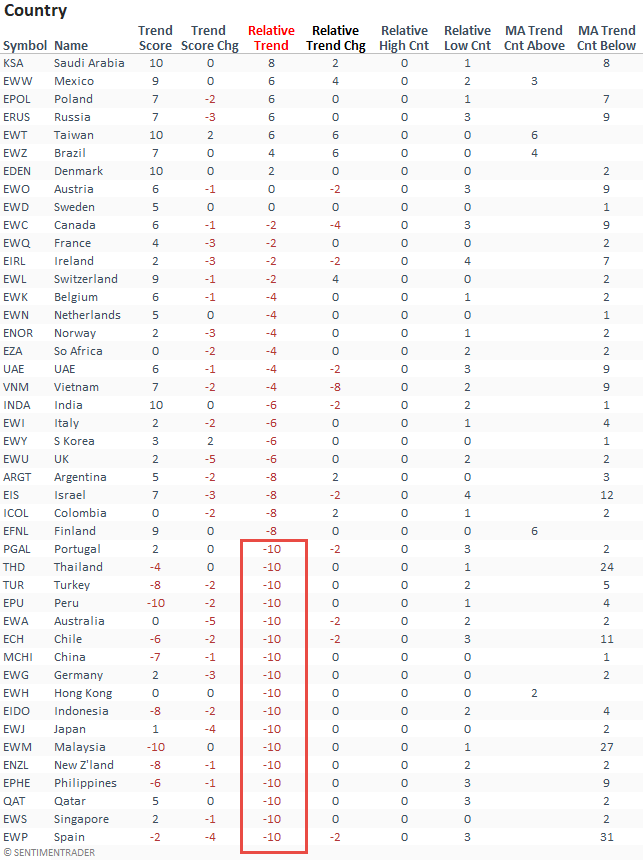
ABSOLUTE & RELATIVE TRENDS - COUNTRIES
Suppose I sort the Country table by the relative trend score column. In that case, it shows a growing number of countries with a relative trend score of -10. Australia, Spain, and Chile joined the -10 club this past week.
Mexico, Taiwan, and Brazil all had notable jumps in their respective relative trend scores on a w/w basis.
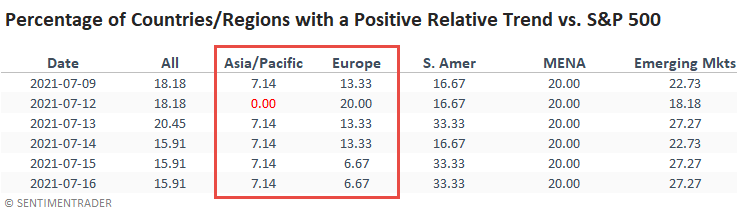
GLOBAL RELATIVE TRENDS
The percentage of countries with a positive relative trend score versus the S&P 500 continues to worsen. It has now fallen to a level that suggests an even more negative forward return outlook for the MSCI ACWI World Index ex USA. I would also note that the Asia/Pacific region fell to zero for the first time since June 2020.
ALL COUNTRY RELATIVE TREND CHART
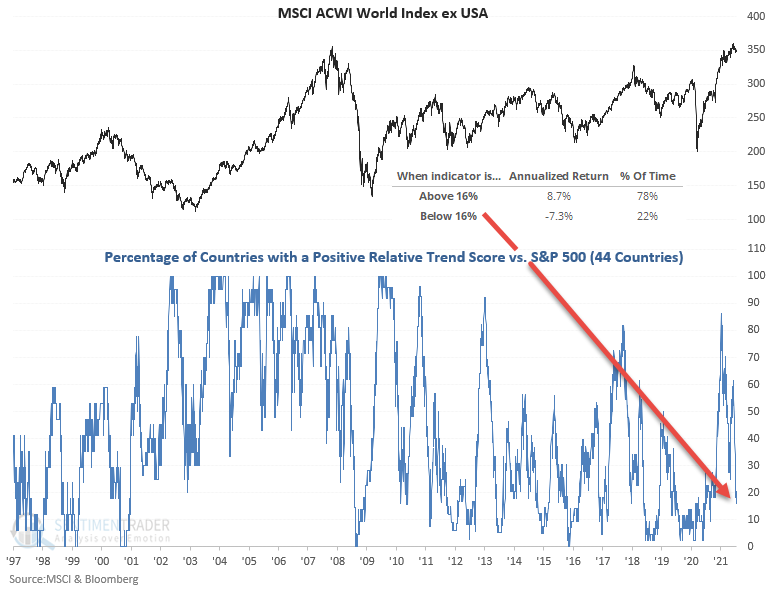
The percentage of countries with a relative trend score of -10 versus the S&P 500 continues to expand and resides at a level that suggests negative returns for the MSCI ACWI World Index ex USA.
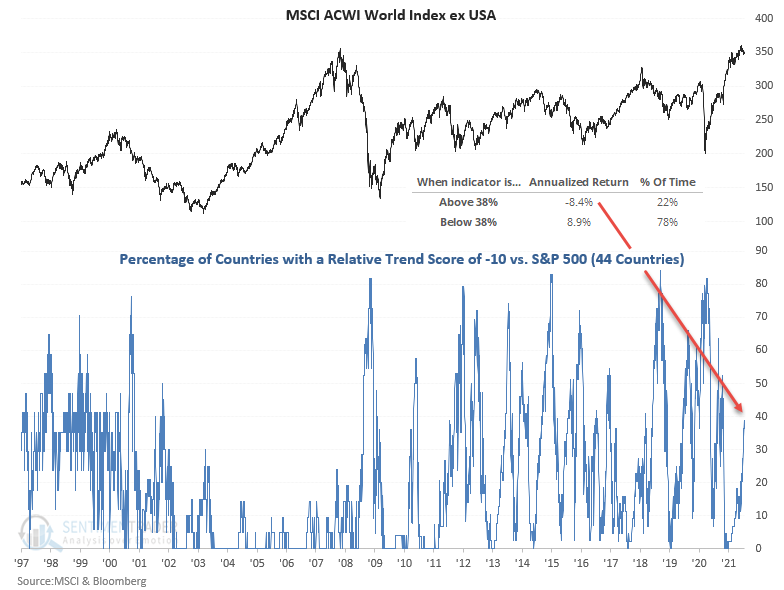
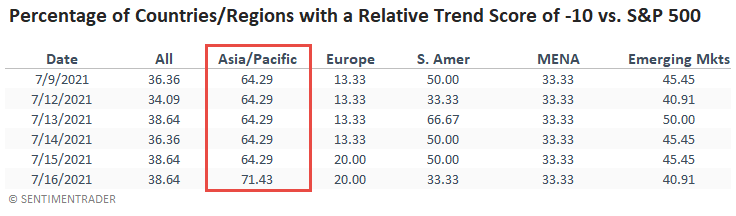
The Asia/Pacific region is dominating the list of countries with a relative trend score of -10 versus the S&P 500.
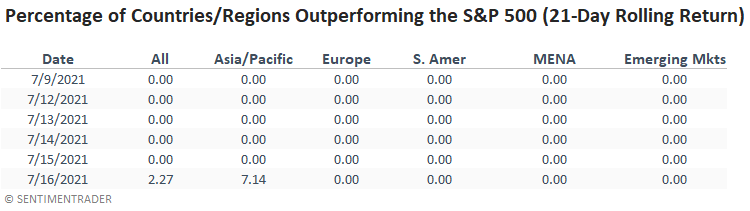
In a note on 7/7/21, I shared a study that assessed the forward return outlook for stocks when the percentage of countries outperforming the S&P 500 on a rolling 21-day basis falls to a low level. Here's a snapshot of the indicator broken down by worldwide regions.
ABSOLUTE AND RELATIVE TREND COLUMN DEFINITIONS
- Absolute Trend Count Score - The absolute trend model contains ten indicators to assess absolute trends across several durations.
- Absolute Trend 5-Day Change - This indicator measures the 5-day net change in the absolute trend model.
- Relative Trend Count Score - The relative trend model contains ten indicators to assess relative trends vs. the S&P across durations.
- Relative Trend 5-Day Change - This indicator measures the 5-day net change in the relative trend model.
- Relative High Count - This indicator measures the number of 21-day relative highs vs. the S&P 500 in the last 5 days.
- Relative Low Count - This indicator measures the number of 21-day relative lows vs. the S&P 500 in the last 5 days.
- Absolute and Relative Trend Scores range from 10 (Best) to -10 (Worst)
- MA Trend Cnt Above - This indicator counts the number of consecutive days above the 10-day moving average.
- MA Trend Cnt Below - This indicator counts the number of consecutive days below the 10-day moving average.