
Absolute & Relative Trend Update

The goal of today's note is to provide you with some insight into what I am seeing with my absolute and relative trend following indicators for domestic and international ETFs.
Data as of 9/17/21 close. All relative comparisons are versus the S&P 500 ETF (SPY). For absolute and relative indicator definitions, please scroll down to the end of the note.
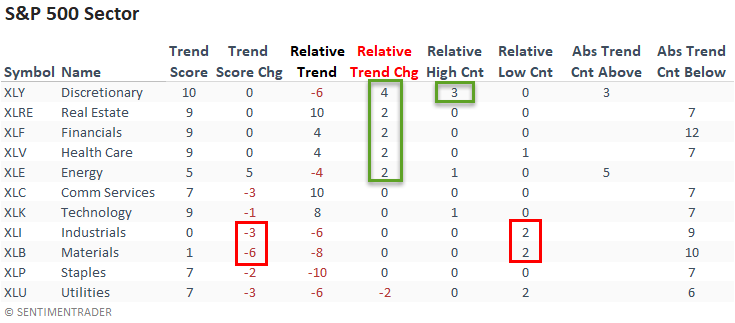
ABSOLUTE & RELATIVE TRENDS - SECTOR ETFS
Interestingly, several sectors registered an increase in their respective relative trend scores in an overall soft week for the broad market. The consumer discretionary sector led the way on the back of a better than expected retail sales report. Cyclical-oriented sectors like industrials and materials continue to soften on an absolute and relative basis.
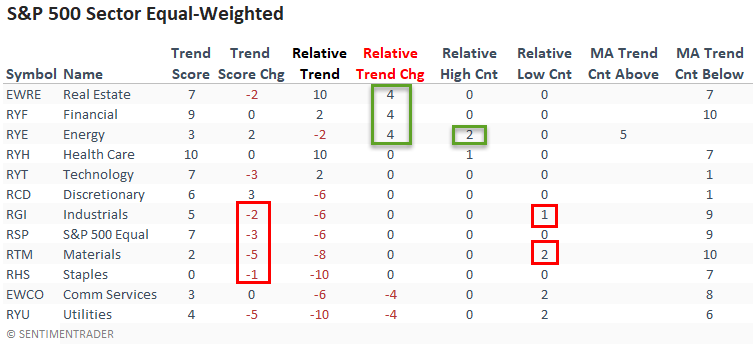
The equal-weighted sector data confirmed the cap-weighted relative trends with improvement in real estate, financials, and energy. And, I would note that energy was the only group to register a new relative high last week. Once again, industrials and materials confirmed the cap-weighted sectors with a deterioration in the absolute trend score.
Interestingly, the defensive-oriented utility sector registered an absolute trend score decline on an equal and cap-weighted basis.
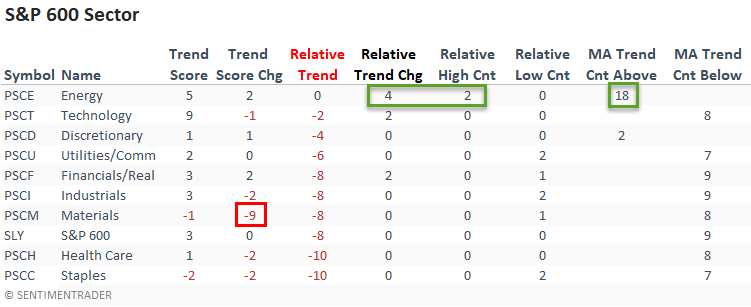
The small-cap energy sector confirmed the large-cap data with several relative highs. And, the trend scores improved on an absolute and relative basis. While none of the small-cap sectors declined on a comparable basis, we did see some further deterioration in the absolute scores, especially in the materials group.
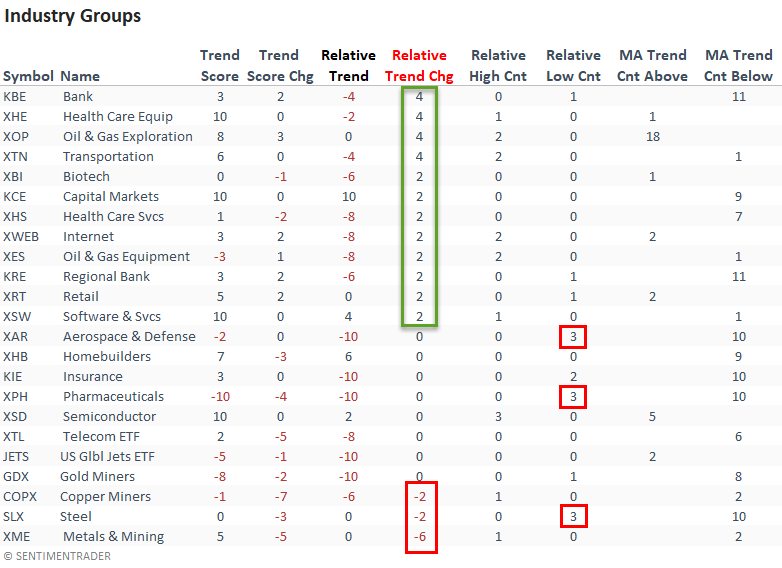
ABSOLUTE & RELATIVE TRENDS - INDUSTRIES
Suppose you sort the industry table according to the relative trend change. In that case, we see more industries with improving trend scores versus a deterioration. I would keep an eye on the metals as they are a critical cyclical group.
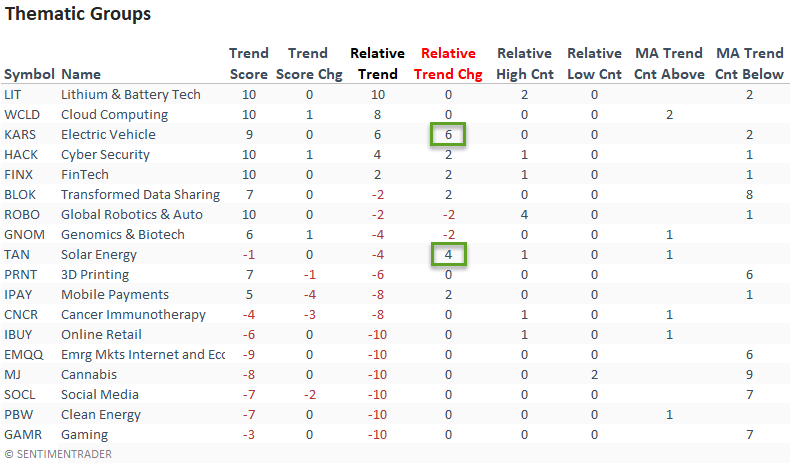
ABSOLUTE & RELATIVE TRENDS - THEMATIC ETFS
Suppose you sort the thematic ETF table according to the relative trend. In that case, we see more groups with negative trend scores versus positive ones.
The lithium & battery technology, cloud computing, and electric vehicle ETFs continue with favorable trends.
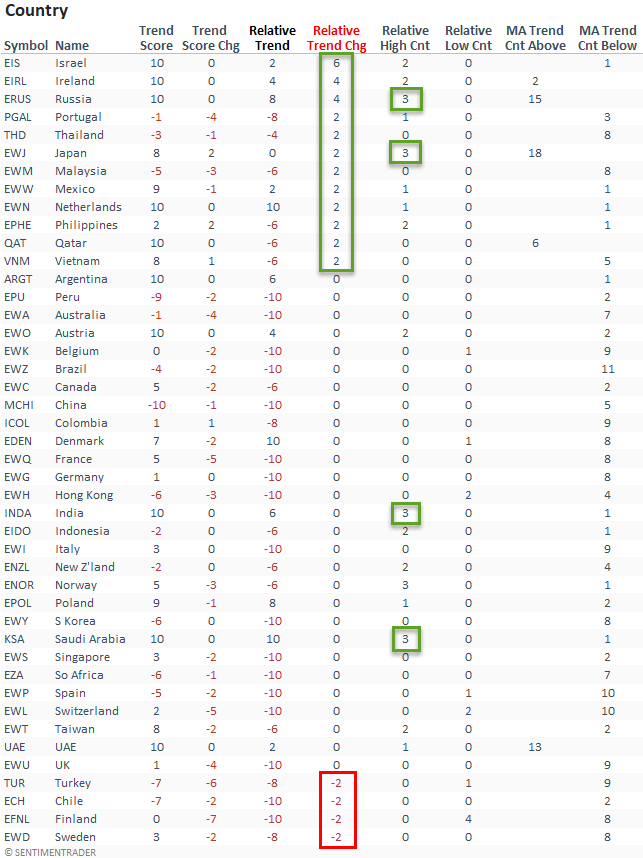
ABSOLUTE & RELATIVE TRENDS - COUNTRIES
Suppose I sort the Country table by the relative trend score change column. In that case, it shows several countries with an improvement in relative scores versus a deterioration.
Russia, an energy-rich country, registered new relative highs on 3/5 days last week.
I would also note the relative highs in Japan, India, and Saudi Arabia.
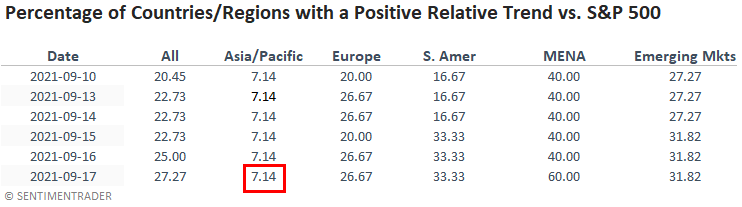
GLOBAL RELATIVE TRENDS
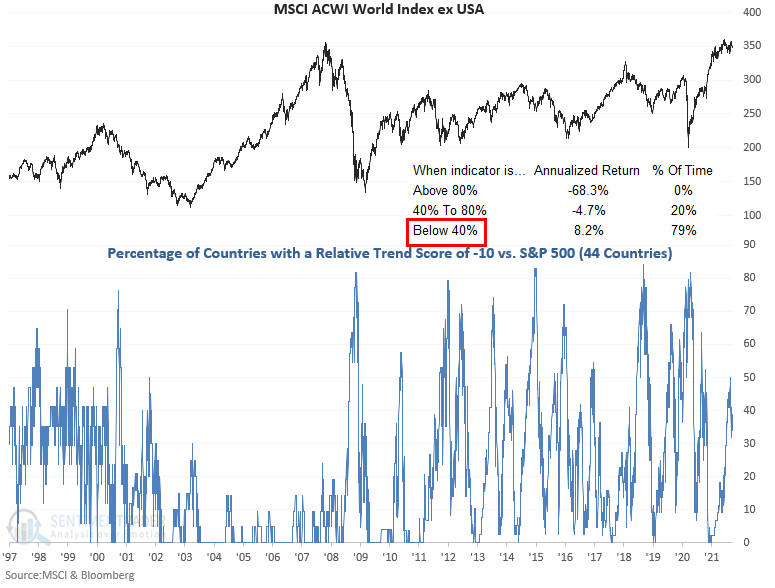
The percentage of countries with a positive relative trend score versus the S&P 500 improved slightly on a w/w basis. The current level, while improving, continues to suggest an unfavorable environment for the MSCI ACWI World Index ex USA.
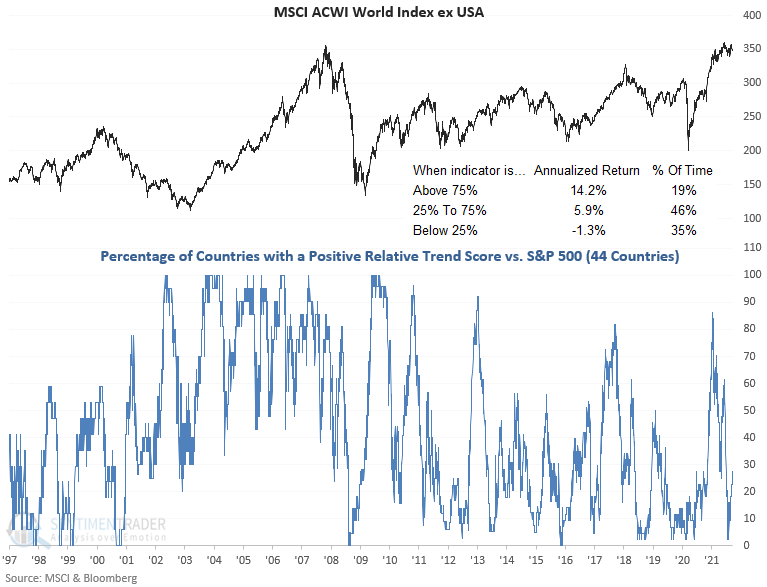
ALL COUNTRY RELATIVE TREND CHART
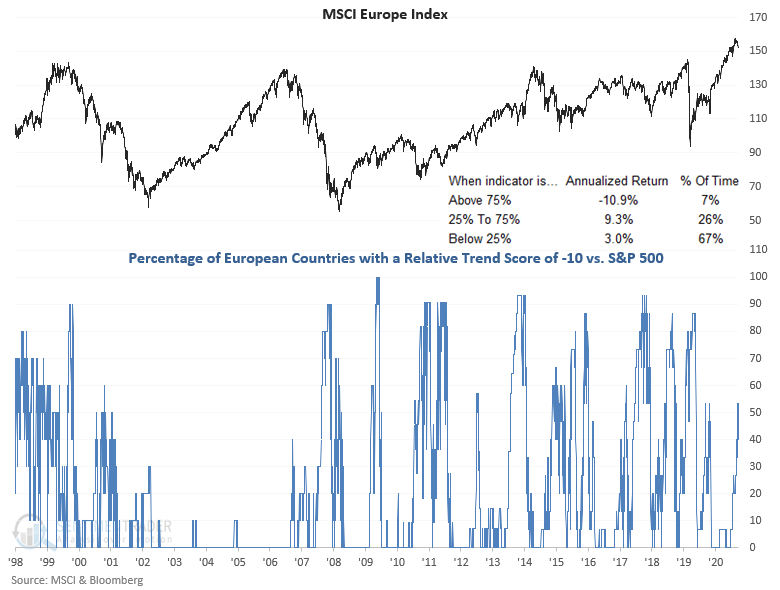
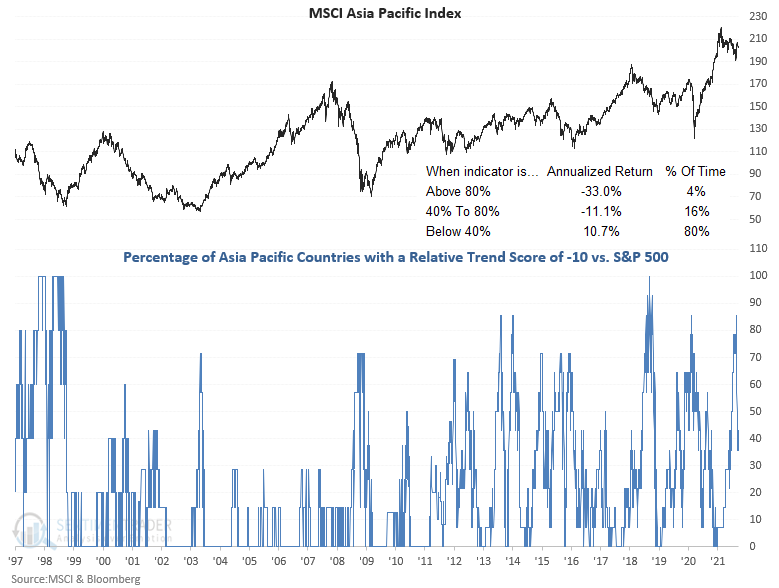
The percentage of countries with a relative trend score of -10 versus the S&P 500 increased slightly on a w/w basis. The Asia Pacific region continues to stabilize at lower levels. I would monitor Europe closely.
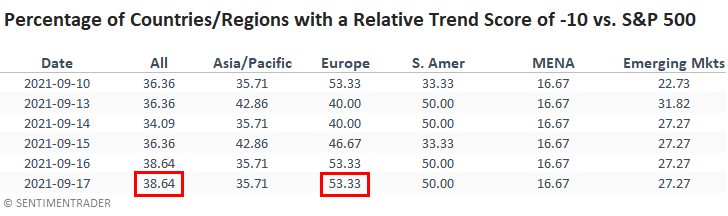
The percentage of countries in Europe with a relative trend score of -10 increased to the highest level since October 2020. Forward returns turn negative when it reaches 75%.
The percentage of countries in the Asia Pacific region with a relative trend score of -10 continues to stabilize at a lower level.
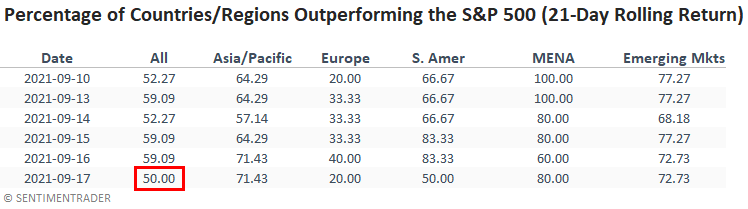
In a note on 7/7/21, I shared a study that assessed the forward return outlook for stocks when the percentage of countries outperforming the S&P 500 on a rolling 21-day basis falls to a low level. Here's a snapshot of the indicator broken down by worldwide regions.
While a few regions showed some noticeable movement, the overall percentage declined slightly.
ABSOLUTE AND RELATIVE TREND COLUMN DEFINITIONS
- Absolute Trend Count Score - The absolute trend model contains ten indicators to assess absolute trends across several durations.
- Absolute Trend 5-Day Change - This indicator measures the 5-day net change in the absolute trend model.
- Relative Trend Count Score - The relative trend model contains ten indicators to assess relative trends vs. the S&P across durations.
- Relative Trend 5-Day Change - This indicator measures the 5-day net change in the relative trend model.
- Relative High Count - This indicator measures the number of 21-day relative highs vs. the S&P 500 in the last 5 days.
- Relative Low Count - This indicator measures the number of 21-day relative lows vs. the S&P 500 in the last 5 days.
- Absolute and Relative Trend Scores range from 10 (Best) to -10 (Worst)
- MA Trend Cnt Above - This indicator counts the number of consecutive days above the 10-day moving average.
- MA Trend Cnt Below - This indicator counts the number of consecutive days below the 10-day moving average.