
Absolute & Relative Trend Update

The goal of today's note is to provide you with some insight into what I am seeing with my absolute and relative trend following indicators for domestic and international ETFs.
Data as of 7/23/21 close. All relative comparisons are versus the S&P 500 ETF (SPY). For absolute and relative indicator definitions, please scroll down to the end of the note.
I'm on vacation this week. Comments will be limited.
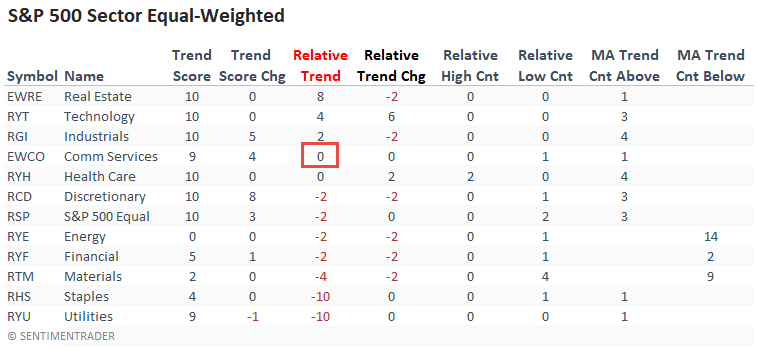
ABSOLUTE & RELATIVE TRENDS - SECTOR ETFS
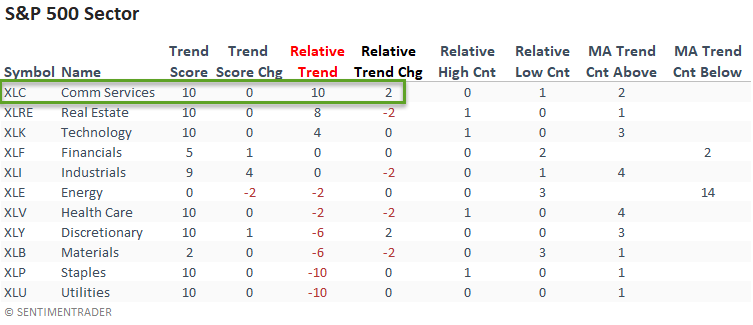
The equal-weighted communication services sector shows a relative trend score of zero. In contrast, the cap-weighted version increased to a perfect ten last week. Once again, we see how mega-cap issues are dominating the cap-weighted benchmarks and driving overall market performance.
I continue to wonder what the economically sensitive small-cap stocks are trying to tell us as the trends across several indicators look troubling.
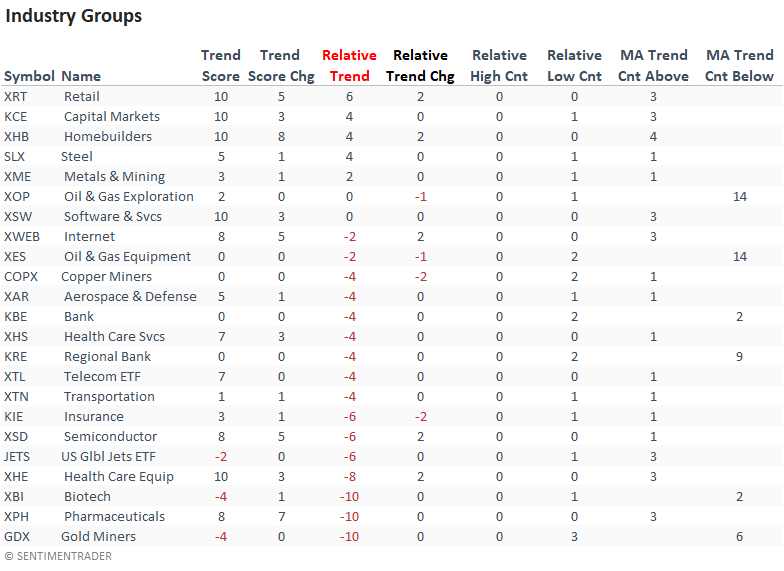
ABSOLUTE & RELATIVE TRENDS - INDUSTRIES
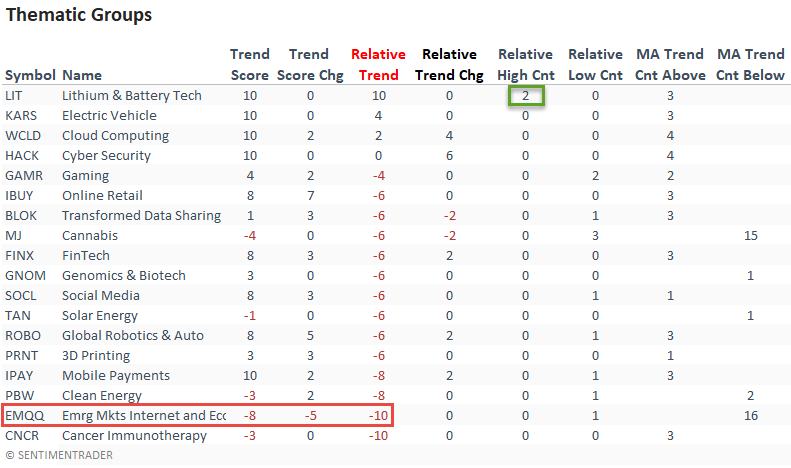
ABSOLUTE & RELATIVE TRENDS - THEMATIC ETFS
Chinese companies continue to drive the underperformance in the Emerging Markets Internet and Ecommerce ETF.
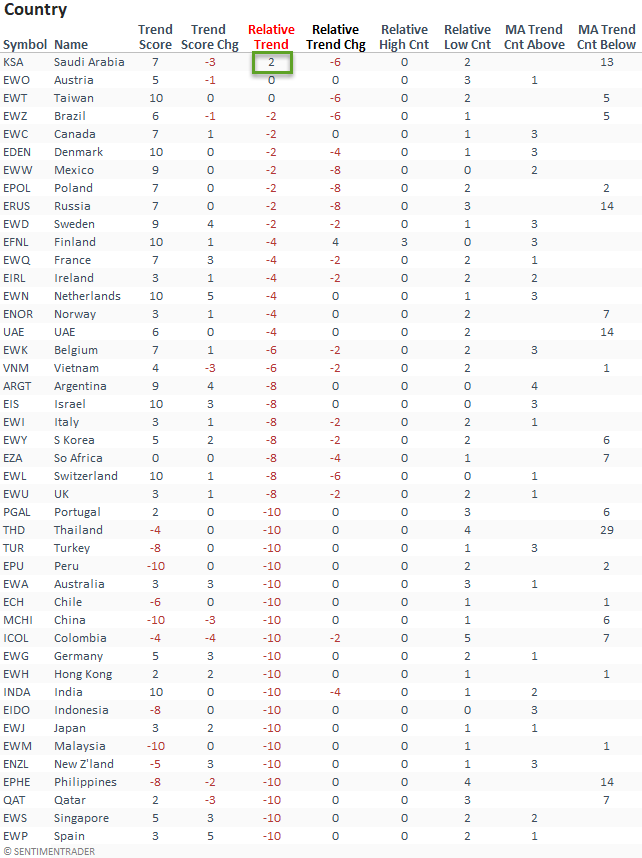
ABSOLUTE & RELATIVE TRENDS - COUNTRIES
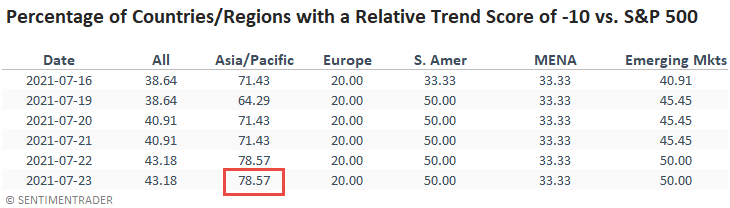
Suppose I sort the Country table by the relative trend score column. In that case, it shows that Saudi Arabia is the only country with a positive score. And, the number of countries with a relative trend score of -10 continues to grow. India was the most notable addition to the -10 club this past week.
The relative trend score for Finland increased on a w/w basis.
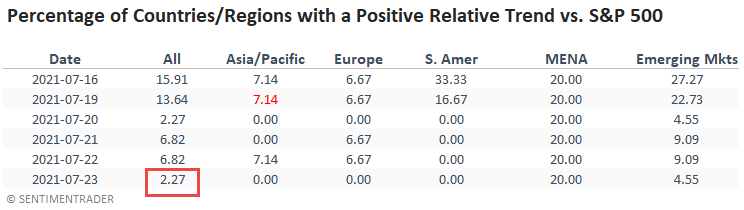
GLOBAL RELATIVE TRENDS
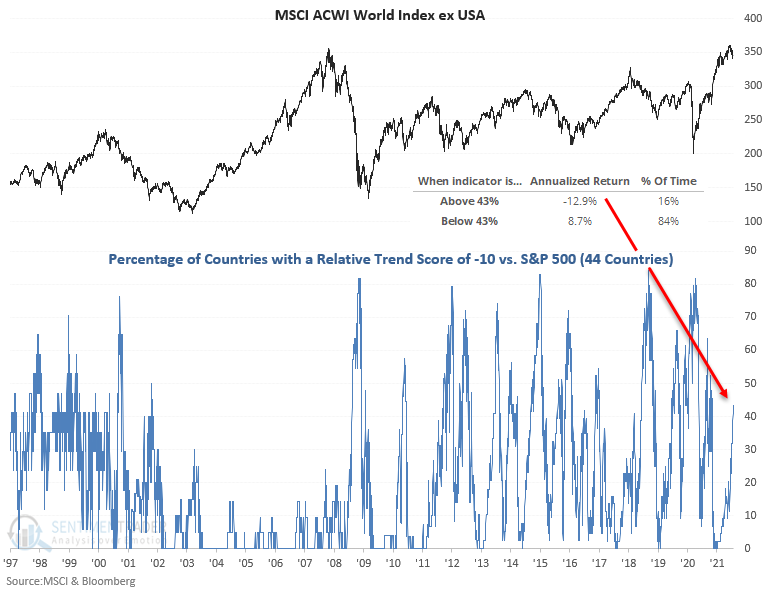
The percentage of countries with a positive relative trend score versus the S&P 500 continues to worsen. It has now fallen to the lowest level since May 2020. The outlook for the MSCI ACWI World Index ex USA is concerning.
ALL COUNTRY RELATIVE TREND CHART
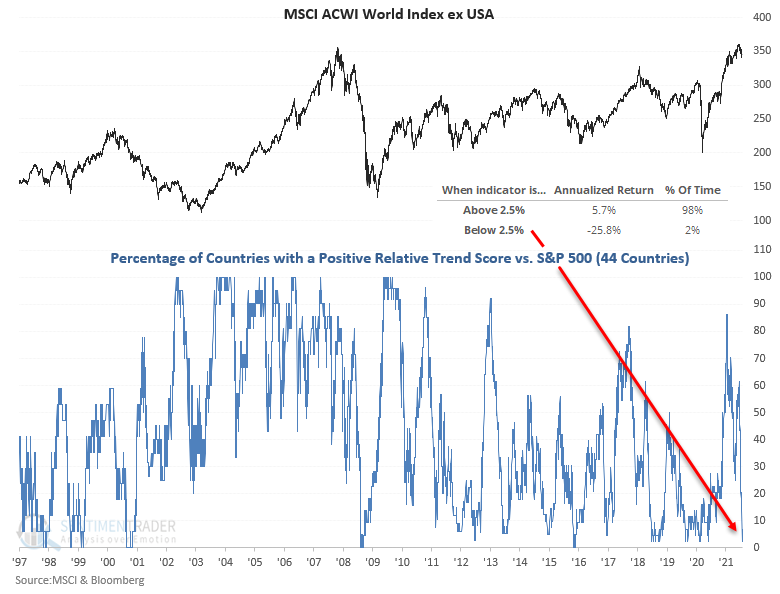
The percentage of countries with a relative trend score of -10 versus the S&P 500 continues to expand and resides at a level that suggests negative returns for the MSCI ACWI World Index ex USA.
The Asia/Pacific region is dominating the list of countries with a relative trend score of -10 versus the S&P 500.
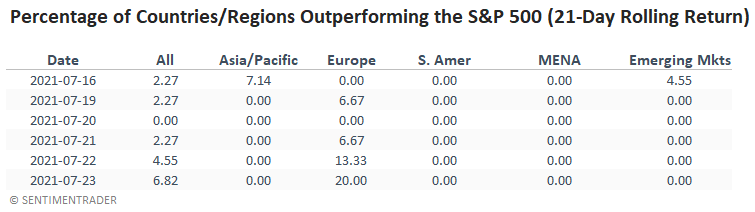
In a note on 7/7/21, I shared a study that assessed the forward return outlook for stocks when the percentage of countries outperforming the S&P 500 on a rolling 21-day basis falls to a low level. Here's a snapshot of the indicator broken down by worldwide regions.
ABSOLUTE AND RELATIVE TREND COLUMN DEFINITIONS
- Absolute Trend Count Score - The absolute trend model contains ten indicators to assess absolute trends across several durations.
- Absolute Trend 5-Day Change - This indicator measures the 5-day net change in the absolute trend model.
- Relative Trend Count Score - The relative trend model contains ten indicators to assess relative trends vs. the S&P across durations.
- Relative Trend 5-Day Change - This indicator measures the 5-day net change in the relative trend model.
- Relative High Count - This indicator measures the number of 21-day relative highs vs. the S&P 500 in the last 5 days.
- Relative Low Count - This indicator measures the number of 21-day relative lows vs. the S&P 500 in the last 5 days.
- Absolute and Relative Trend Scores range from 10 (Best) to -10 (Worst)
- MA Trend Cnt Above - This indicator counts the number of consecutive days above the 10-day moving average.
- MA Trend Cnt Below - This indicator counts the number of consecutive days below the 10-day moving average.