
Absolute & Relative Trend Update

The goal of today's note is to provide you with some insight into what I am seeing with my absolute and relative trend following indicators for domestic and international ETFs.
Data as of 9/24/21 close. All relative comparisons are versus the S&P 500 ETF (SPY). For absolute and relative indicator definitions, please scroll down to the end of the note.
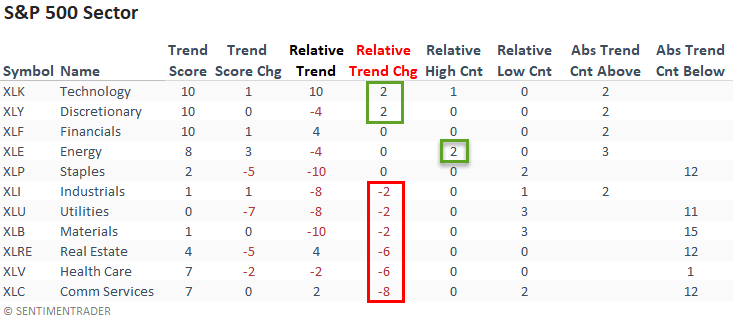
ABSOLUTE & RELATIVE TRENDS - SECTOR ETFS
The technology sector returned to a perfect combined trend score with an absolute and relative trend score increase. While its relative trend score remains negative, the discretionary continues to improve.
I would note that energy was the only sector to register multiple relative highs last week.
Cyclical-oriented sectors like industrials and materials continue to soften on a relative basis.
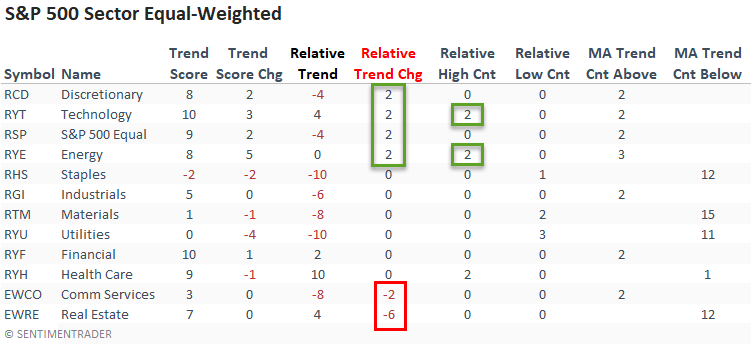
The equal-weighted sector data confirmed the cap-weighted relative trends with improvement in the technology and discretionary sectors.
Energy stocks look slightly better on an equal-weighted basis with a better trend score. And, I would note that it also registered two new relative highs.
The S&P 500 equal-weighted index registered an increase in its relative score, highlighting broad participation by most stocks.
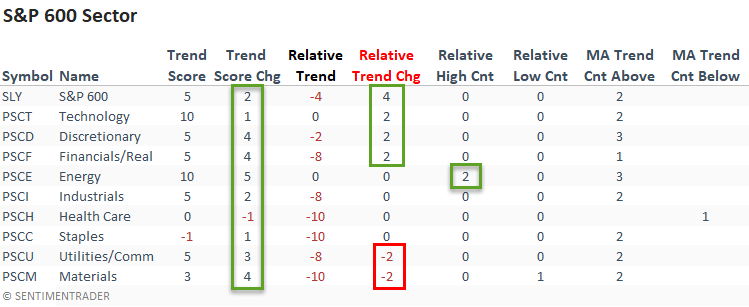
Small-cap stocks had a lovely week with improvement on an absolute and relative basis.
The relative trend score for energy held steady. However, the sector registered multiple new relative highs.
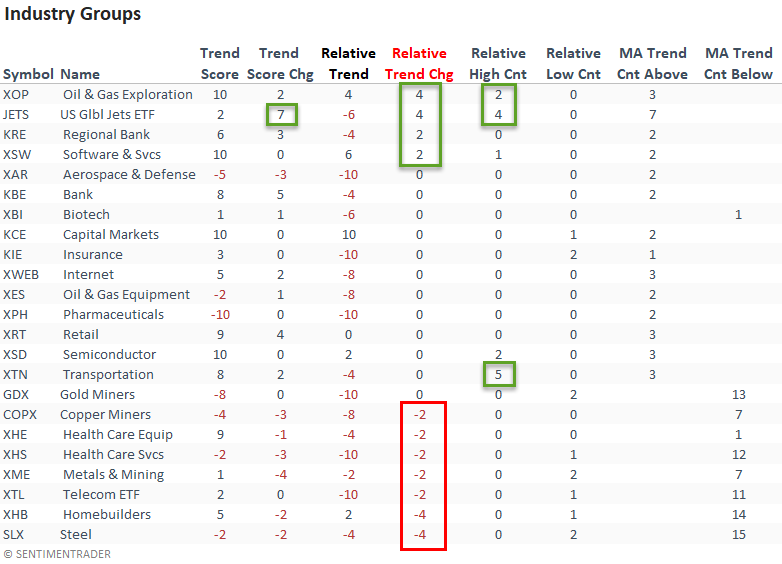
ABSOLUTE & RELATIVE TRENDS - INDUSTRIES
Suppose you sort the industry table according to the relative trend change. In that case, we see notable improvement from oil & gas exploration and airlines. Airlines, a component in the transportation industry, registered new relative highs on 4/5 days last week.
The metals and steel industries continue to deteriorate.
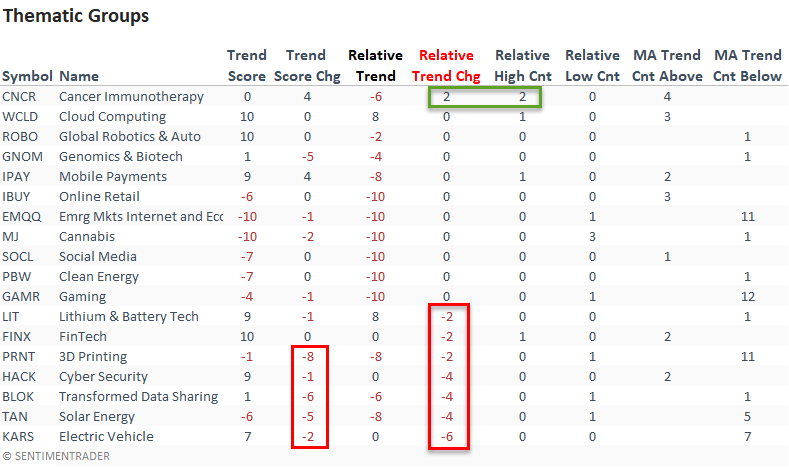
ABSOLUTE & RELATIVE TRENDS - THEMATIC ETFS
Suppose you sort the thematic ETF table according to the relative trend change. In that case, we see more groups with negative trend scores versus positive ones. And, I would note that some of the better groups lost ground on the week, especially the electric vehicle ETF.
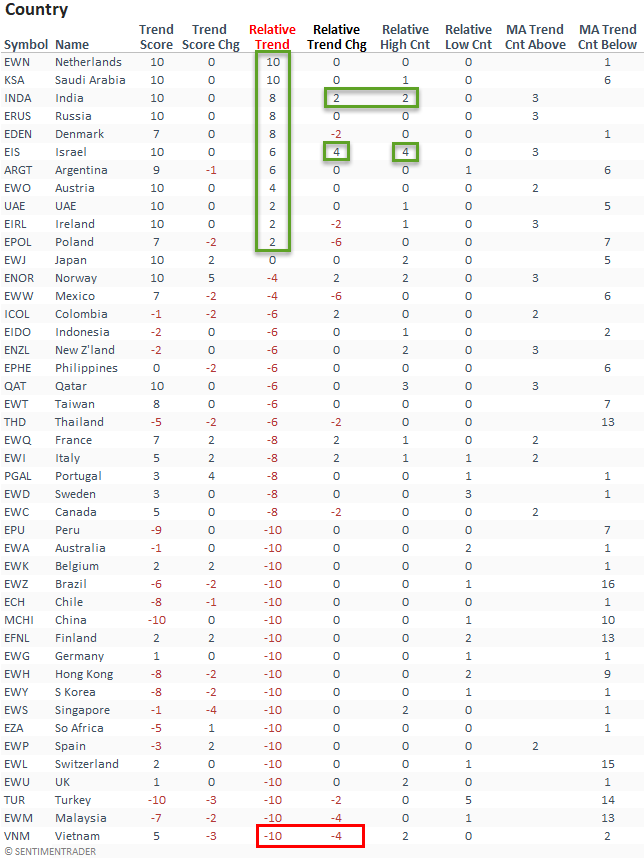
ABSOLUTE & RELATIVE TRENDS - COUNTRIES
Suppose I sort the Country table by the relative trend score column. In that case, it shows significantly more countries with a negative relative trend score than a positive one.
India and Israel continue to improve, with the latter registering new relative highs on 4/5 days last week.
Vietnam, a former leader in Asia, returned to a -10 relative trend score.
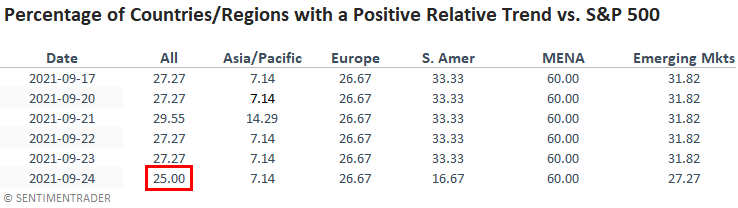
GLOBAL RELATIVE TRENDS
The percentage of countries with a positive relative trend score versus the S&P 500 declined slightly on a w/w basis. The current level continues to suggest an unfavorable environment for the MSCI ACWI World Index ex USA.
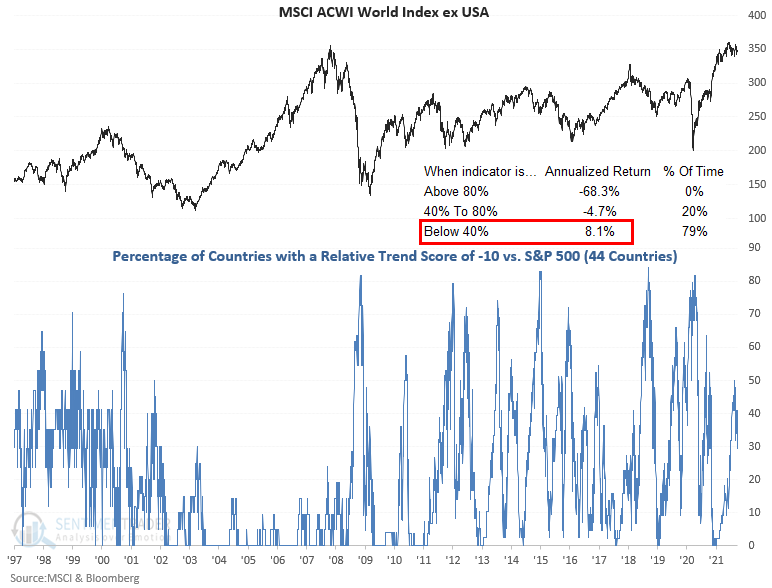
ALL COUNTRY RELATIVE TREND CHART
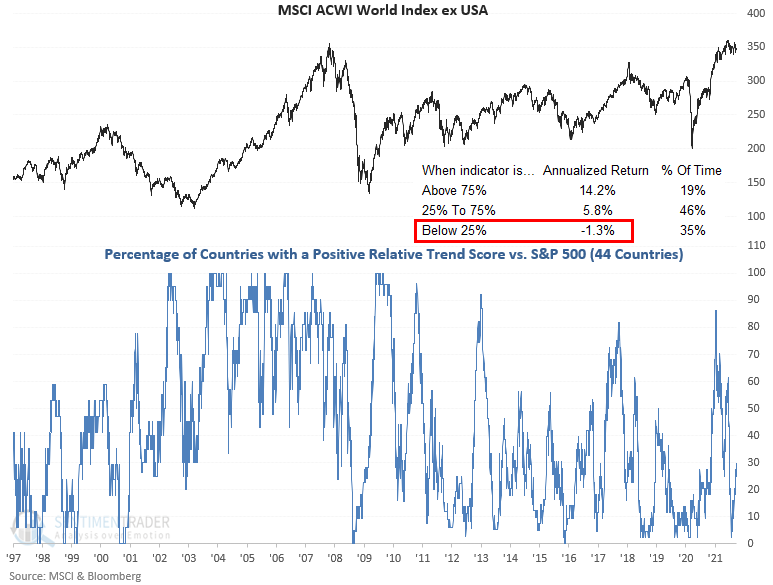
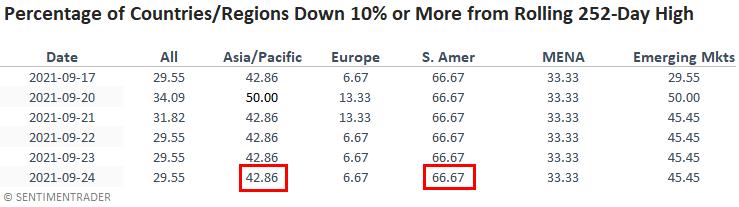
The percentage of countries with a relative trend score of -10 versus the S&P 500 increased slightly on a w/w basis. The Asia Pacific region increased as Europe declined.
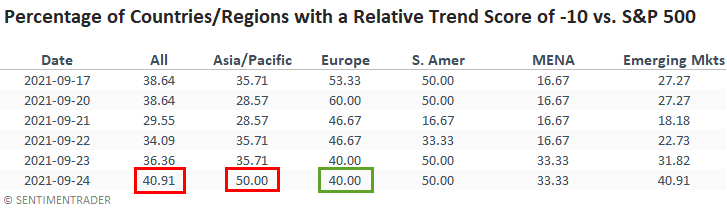
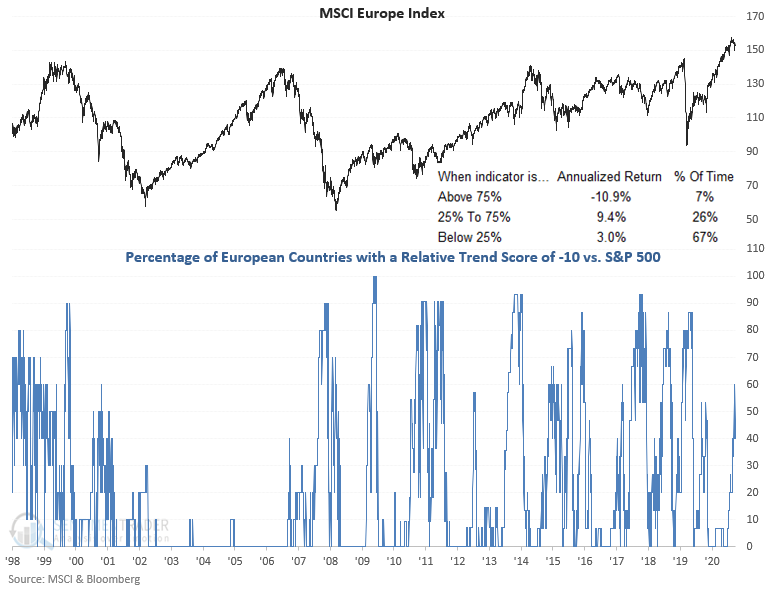
The percentage of countries in Europe with a relative trend score of -10 declined on a w/w basis.
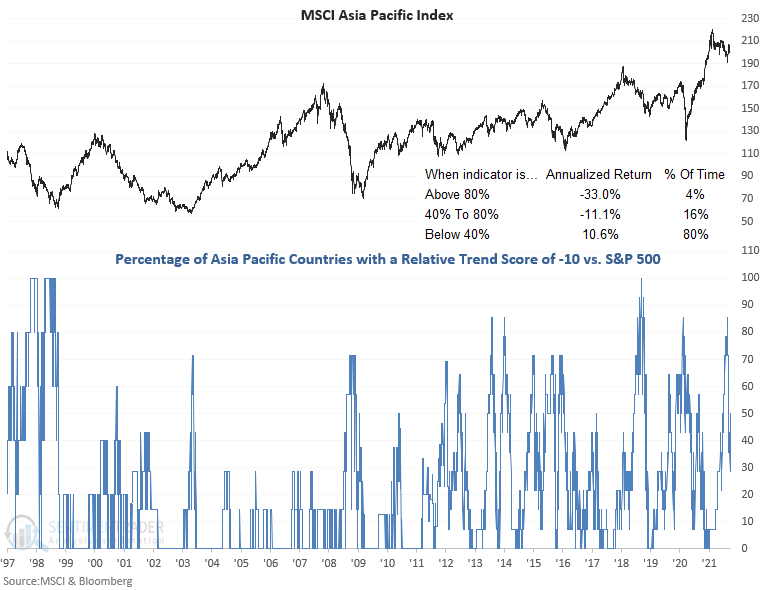
The percentage of countries in the Asia Pacific region with a relative trend score of -10 increased on a w/w basis. I think this is a must-watch indicator on a go-forward basis as the supply chain and shipping bottlenecks coming out of Asia are noteworthy.
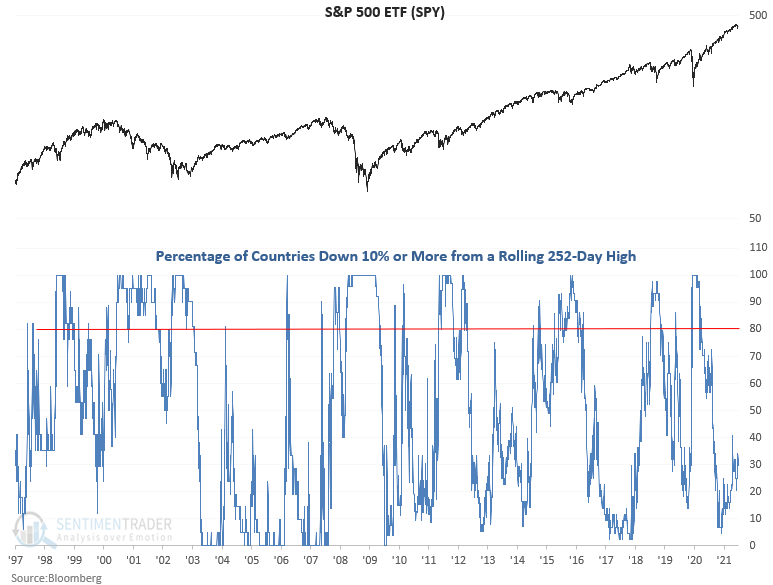
The percentage of countries down 10% or more (in a correction) from a rolling 252-day is an excellent series to monitor. It can highlight a divergence between global indices and the USA. Typically, when the percentage of countries down 10% or more increases to 80% and the S&P 500 is near a high, take note.
The most recent divergence occurred in October 2018 when 85% of countries were down 10% or more, and the S&P 500 was down less than 2% from its respective high. The S&P 500 subsequently corrected by almost 20%.
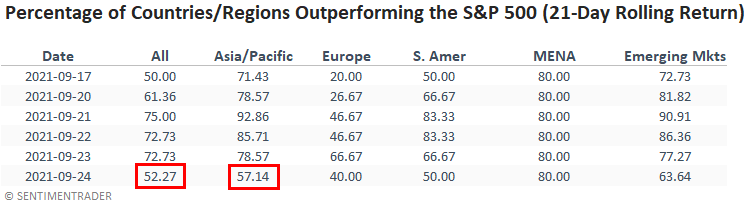
In a note on 7/7/21, I shared a study that assessed the forward return outlook for stocks when the percentage of countries outperforming the S&P 500 on a rolling 21-day basis falls to a low level. Here's a snapshot of the indicator broken down by worldwide regions.
Asia deteriorated as Europe improved.
ABSOLUTE AND RELATIVE TREND COLUMN DEFINITIONS
- Absolute Trend Count Score - The absolute trend model contains ten indicators to assess absolute trends across several durations.
- Absolute Trend 5-Day Change - This indicator measures the 5-day net change in the absolute trend model.
- Relative Trend Count Score - The relative trend model contains ten indicators to assess relative trends vs. the S&P across durations.
- Relative Trend 5-Day Change - This indicator measures the 5-day net change in the relative trend model.
- Relative High Count - This indicator measures the number of 21-day relative highs vs. the S&P 500 in the last 5 days.
- Relative Low Count - This indicator measures the number of 21-day relative lows vs. the S&P 500 in the last 5 days.
- Absolute and Relative Trend Scores range from 10 (Best) to -10 (Worst)
- MA Trend Cnt Above - This indicator counts the number of consecutive days above the 10-day moving average.
- MA Trend Cnt Below - This indicator counts the number of consecutive days below the 10-day moving average.