
Absolute & Relative Trend Update

The goal of today's note is to provide you with some insight into what I am seeing with my absolute and relative trend following indicators for domestic and international ETFs.
Data as of 6/25/21 close. All relative comparisons are versus the S&P 500 ETF (SPY). For absolute and relative indicator definitions, please scroll down to the end of the note.
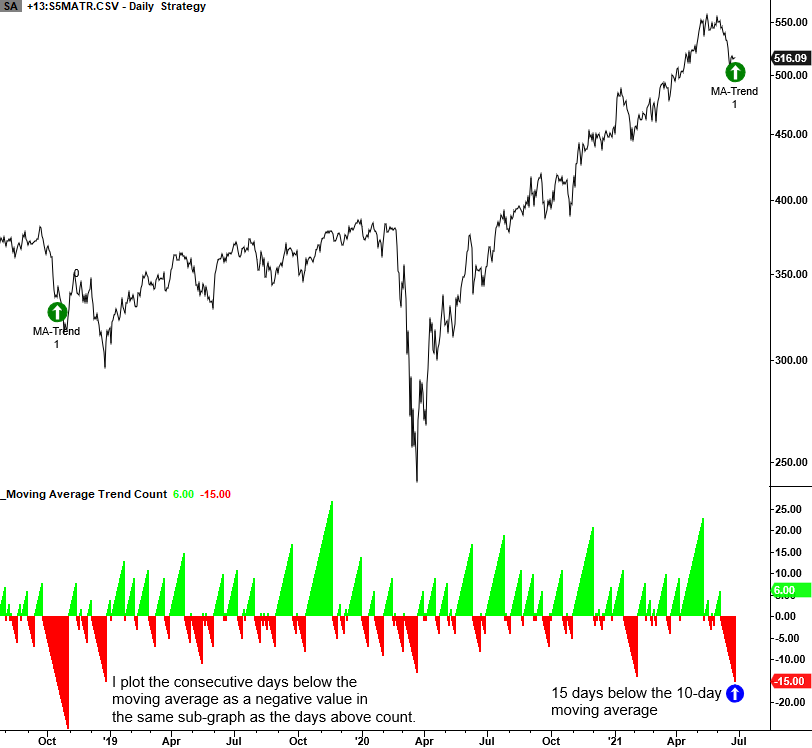
I added the consecutive days above or below the 10-day moving average count to the indicator tables. Please click on the following note for a trading signal based on the moving average trend count concept. Click here.
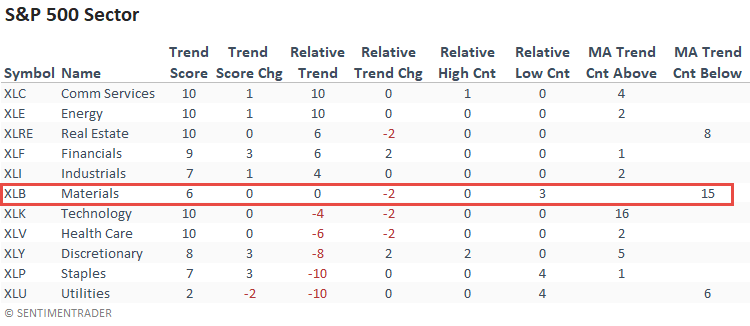
ABSOLUTE & RELATIVE TRENDS - SECTOR ETFS
The relative trend score for the basic materials sector deteriorated with a new relative low on 3/5 days last week. I would also note that short-term price momentum is weak, with the sector closing below its 10-day moving average for 15 consecutive days. After improving in the previous week, the technology relative trend score declined by a modest amount. However, short-term price momentum remains strong as the sector has now closed above its 10-day moving average for 16 consecutive days.
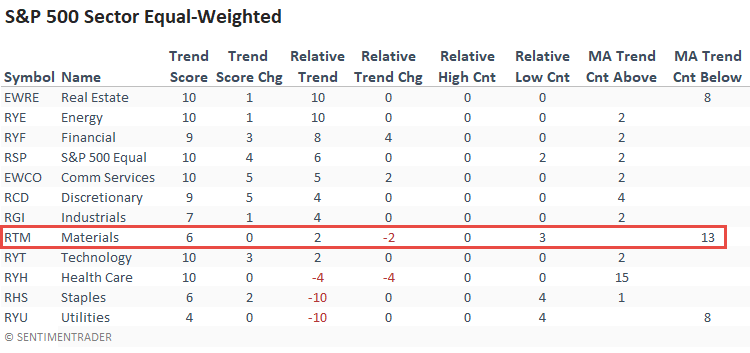
The equal-weighted materials sector shows the same deteriorating profile as the cap-weighted group with a like amount of relative lows and weak short-term price momentum. Interestingly, the short-term price momentum in health care looks strong as the sector has now closed above its 10-day moving average for 15 consecutive days. I would also note the bounce back in the absolute trend score for several sectors as the S&P 500 closed higher on 4/5 days.
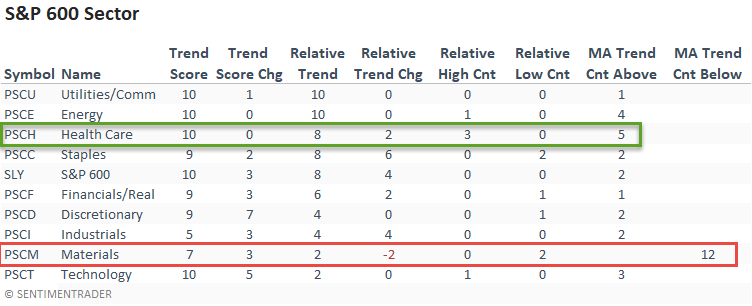
The message from the small-cap materials sector looks similar to large caps. The improvement in health care is noteworthy.
The S&P 500 materials sector has now traded below its 10-day moving average for 15 consecutive days. Let's conduct a study to identify other instances in history when it has reached this level. I will also add a condition identifying the first instance after a 252-day high to assess similar cases to the current signal.
HOW THE SIGNALS PERFORMED
The returns look slightly better than the study period in the short term. Still, nothing stands out that suggest we should be looking to play a mean reversion signal. This study provides an excellent example of why I developed a model that waits for price momentum to turn up before taking a trade.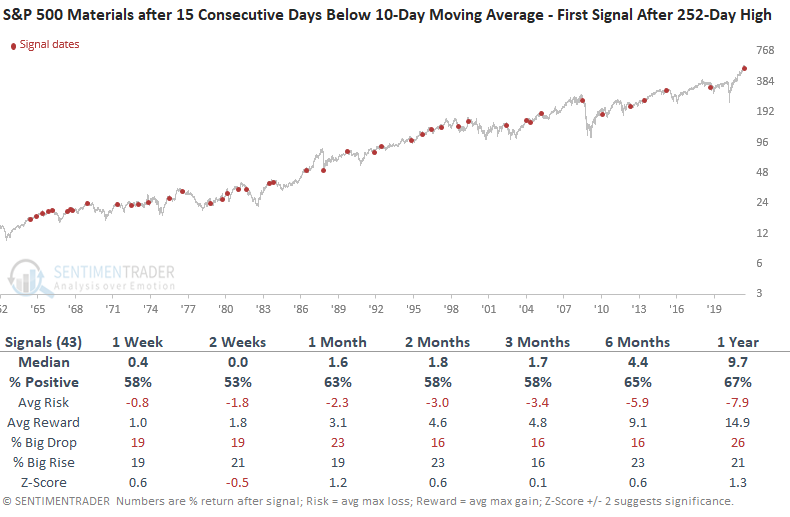
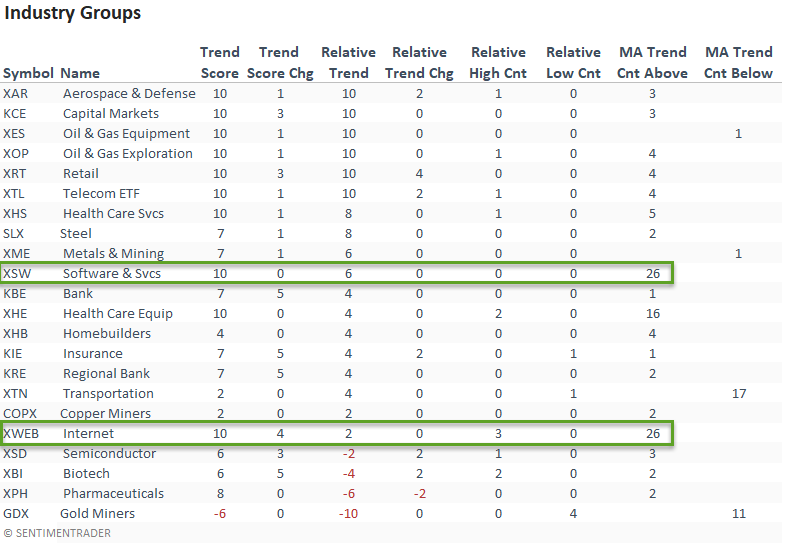
ABSOLUTE & RELATIVE TRENDS - INDUSTRIES
I highlighted a moving average trend count signal for the Software and Internet industries in a note last week. The momentum continues.
ABSOLUTE & RELATIVE TRENDS - THEMATIC ETFS
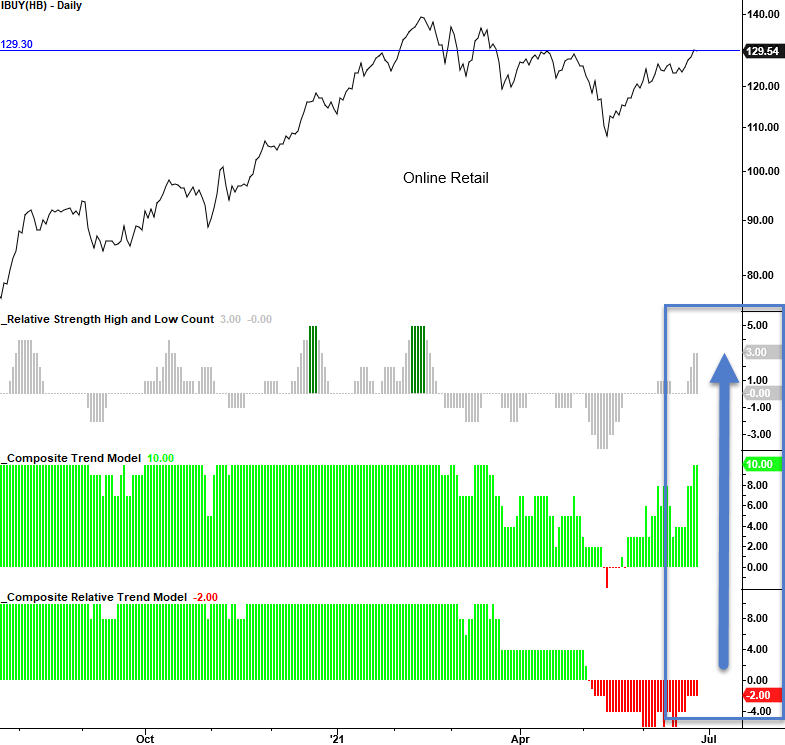
The online retail ETF looks interesting as the absolute trend score returned to a ten last week for the first time since March. I would also note that the ETF registered a new relative high on 3/5 days. The improvement in the 3D Printing ETF is noteworthy.
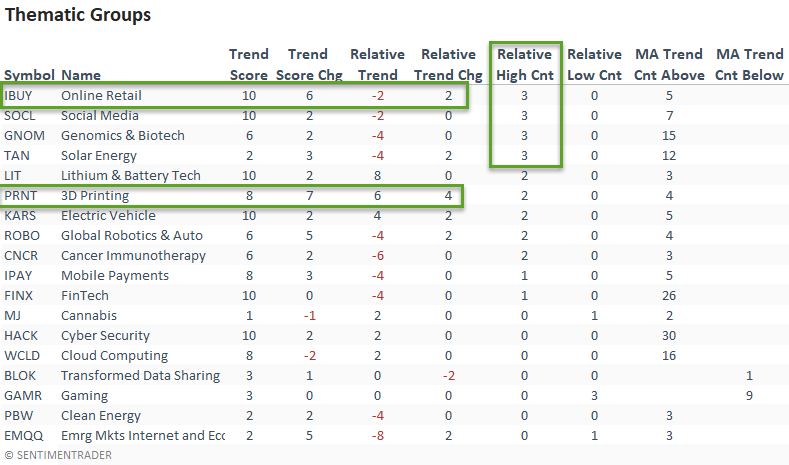
CHART IN FOCUS - ONLINE RETAIL
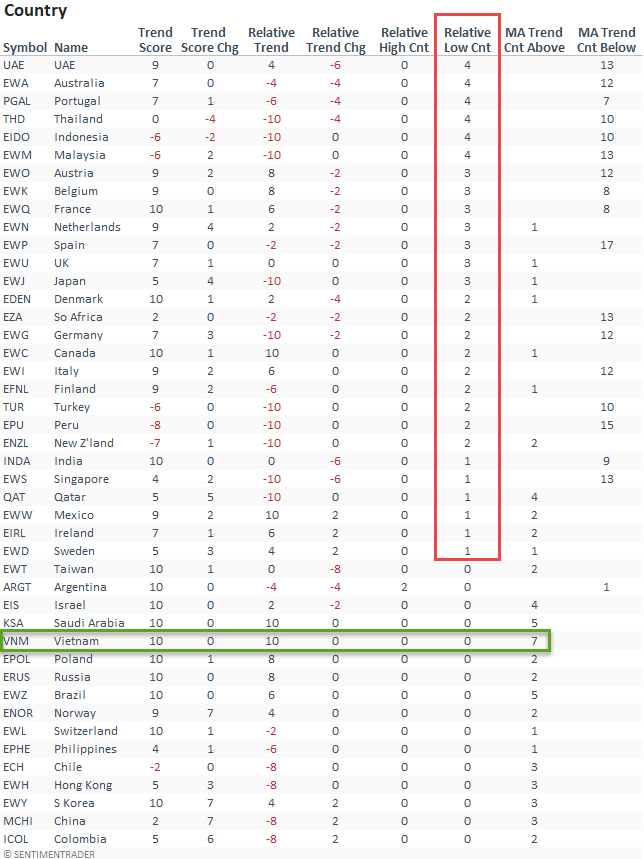
ABSOLUTE & RELATIVE TRENDS - COUNTRIES
Suppose I sort the Country table by relative low count. In that case, it shows a significant number of countries registered new relative lows versus the S&P 500 last week. The deterioration was widespread across the globe. Vietnam ended the week on a strong note and has the best short-term price momentum of any country.
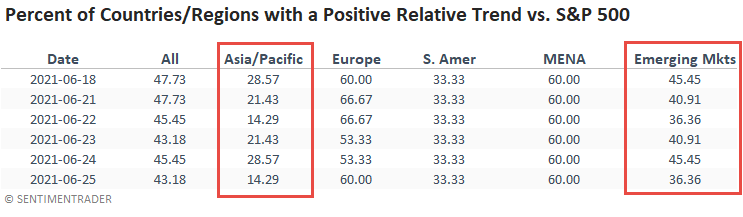
GLOBAL RELATIVE TRENDS
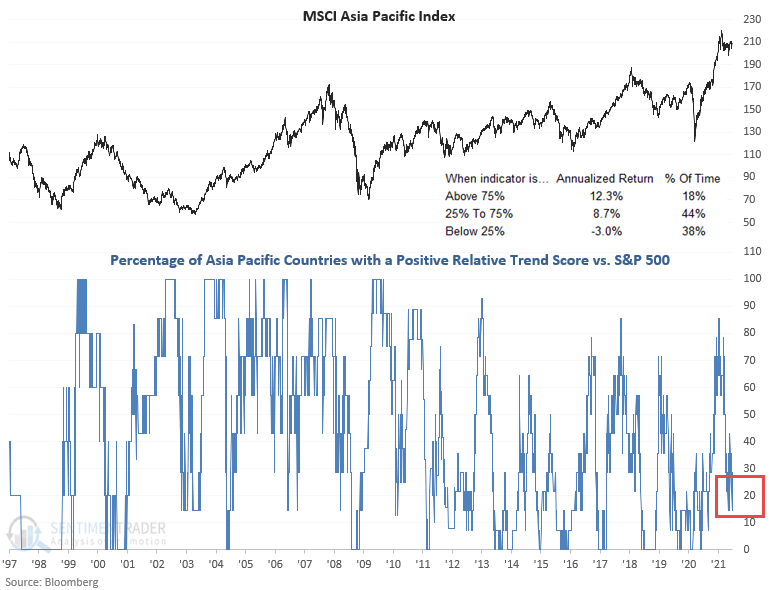
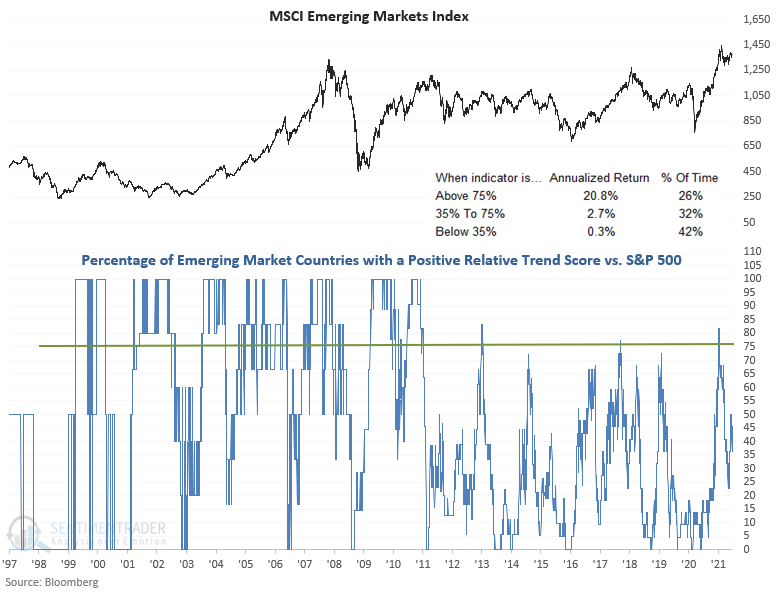
The percentage of Asia-Pacific countries with a positive relative trend score versus the S&P 500 has fallen to a level that suggests one should be careful with a broad-based allocation to the region. The emerging markets, which Asia heavily influences, offer a cautionary message as well.
ASIA PACIFIC RELATIVE TREND CHART
EMERGING MARKET RELATIVE TREND CHART
ABSOLUTE AND RELATIVE TREND COLUMN DEFINITIONS
- Absolute Trend Count Score - The absolute trend model contains ten indicators to assess absolute trends across several durations.
- Absolute Trend 5-Day Change - This indicator measures the 5-day net change in the absolute trend model.
- Relative Trend Count Score - The relative trend model contains ten indicators to assess relative trends vs. the S&P across durations.
- Relative Trend 5-Day Change - This indicator measures the 5-day net change in the relative trend model.
- Relative High Count - This indicator measures the number of 21-day relative highs vs. the S&P 500 in the last 5 days.
- Relative Low Count - This indicator measures the number of 21-day relative lows vs. the S&P 500 in the last 5 days.
- Absolute and Relative Trend Scores range from 10 (Best) to -10 (Worst)