
Absolute & Relative Trend Update

The goal of today's note is to provide you with some insight into what I am seeing with my absolute and relative trend following indicators for domestic and international ETFs.
Data as of 10/1/21 close. All relative comparisons are versus the S&P 500 ETF (SPY). For absolute and relative indicator definitions, please scroll down to the end of the note.
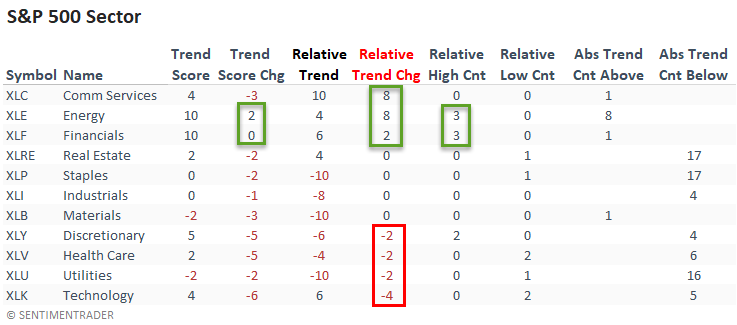
ABSOLUTE & RELATIVE TRENDS - SECTOR ETFS
The energy sector continued to improve with trend score gains on an absolute and relative basis in an overall soft week for the broad market. I would also add that the group registered a new relative high on 3/5 days.
The financial and communication services sectors are worth noting as both showed improvement on a relative basis, especially the latter.
The gains in the reopening groups came at the expense of growth-oriented sectors like technology and health care.
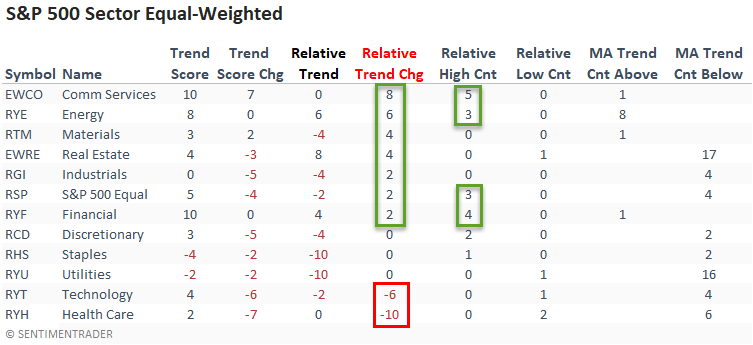
The equal-weighted sector data highlights the improvement in the reopening trade as the average stock improved at the expense of growth-oriented groups like technology and health care.
I would also note that the equal-weighted communications sector confirmed the improving relative trends in the cap-weighted data.
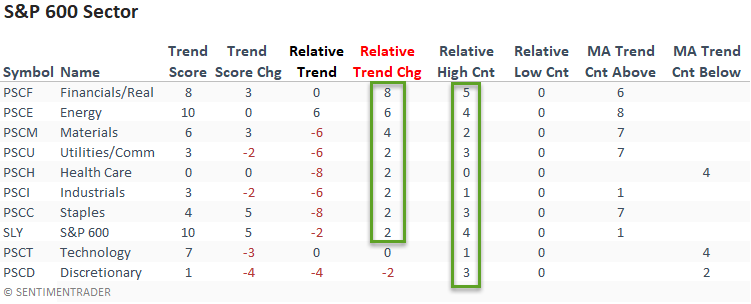
Small-cap stocks showed noticeable improvement on an absolute and relative basis. And, all but one sector registered a new relative high last week.
I would monitor small-cap stocks closely as the economically sensitive group could provide a spark for a fourth-quarter rally.
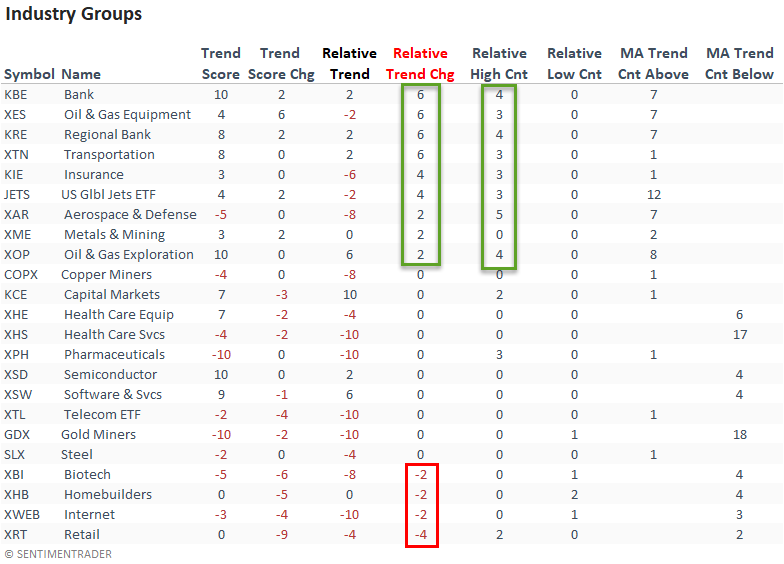
ABSOLUTE & RELATIVE TRENDS - INDUSTRIES
Suppose you sort the industry table according to the relative trend change. In that case, we see a notable improvement from cyclical-oriented groups like banks, energy, and transportation. And, I would note that several of the same groups registered multiple relative highs.
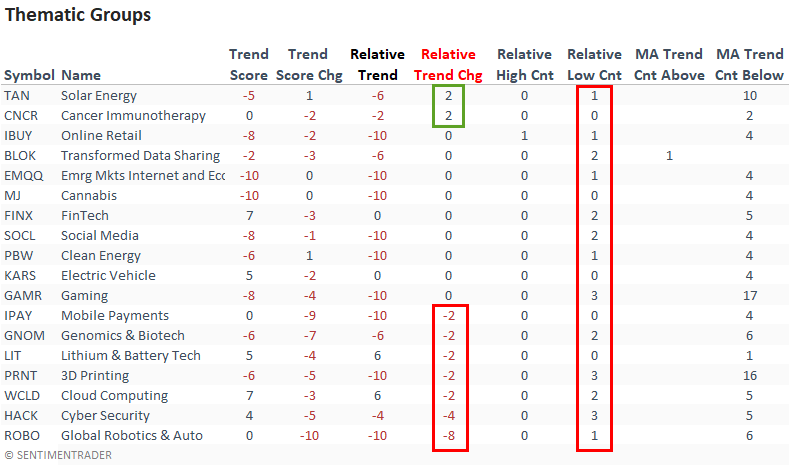
ABSOLUTE & RELATIVE TRENDS - THEMATIC ETFS
Suppose you sort the thematic ETF table according to the relative trend change column. In that case, we see more groups with a deterioration in their respective trend score versus an improvement. And, I would note that a significant number of groups registered new relative lows last week.
ABSOLUTE & RELATIVE TRENDS - COUNTRIES
Suppose I sort the Country table by the relative trend score change column. In that case, it shows significantly more countries with an improvement in their respective trend score versus a deterioration.
Norway, Colombia, and Austria registered several new relative highs last week.

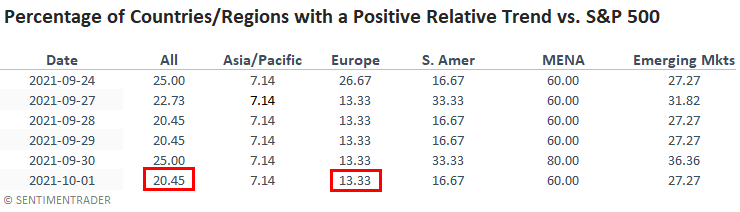
GLOBAL RELATIVE TRENDS
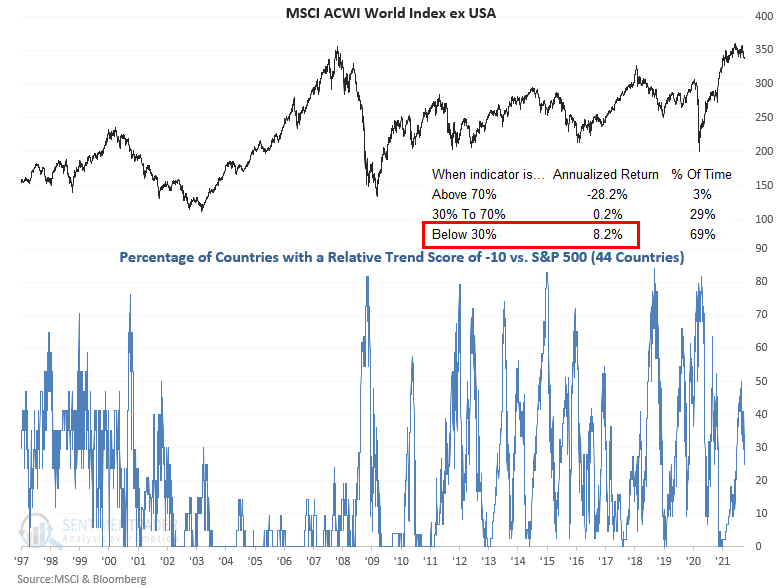
The percentage of countries with a positive relative trend score versus the S&P 500 declined slightly on a w/w basis. The current level continues to suggest an unfavorable environment for the MSCI ACWI World Index ex USA.
ALL COUNTRY RELATIVE TREND CHART
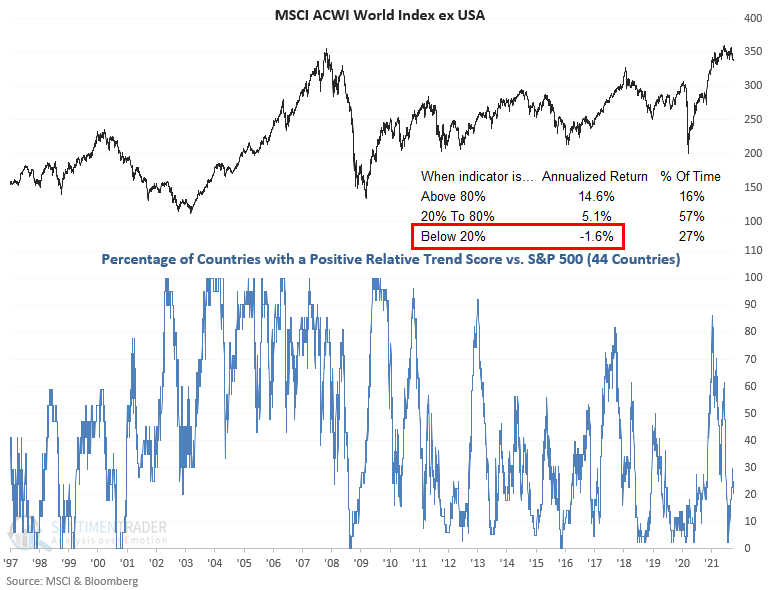
The percentage of countries with a relative trend score of -10 versus the S&P 500 decreased across all regions on a w/w basis. So, we see improvement off the worst possible level. Still, most countries continue to maintain an unfavorable performance profile versus the S&P 500.
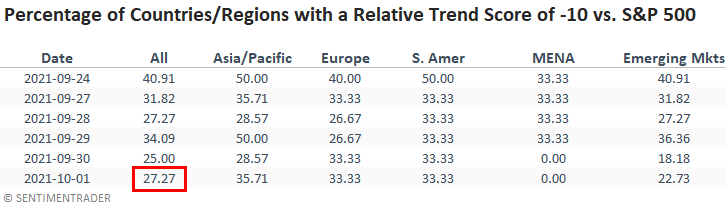
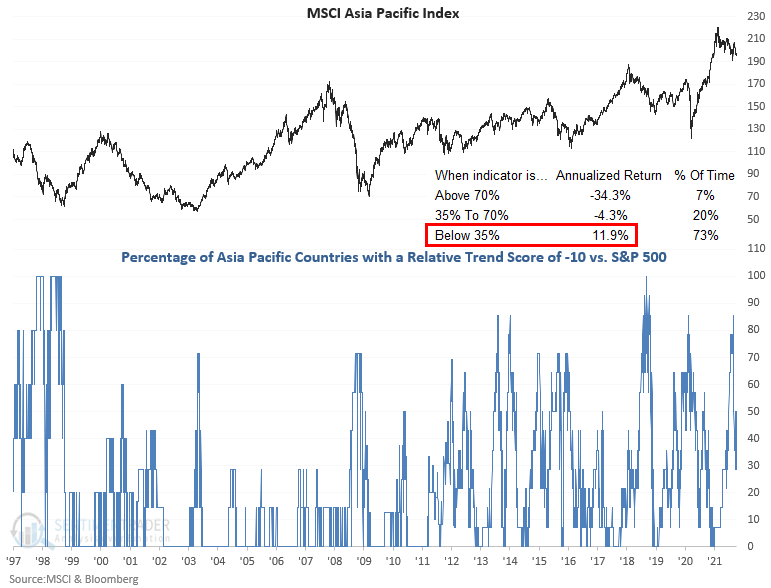
The percentage of countries in the Asia Pacific region with a relative trend score of -10 decreased on a w/w basis. I think this is a must-watch indicator on a go-forward basis as the supply chain and shipping bottlenecks are impacting the region.
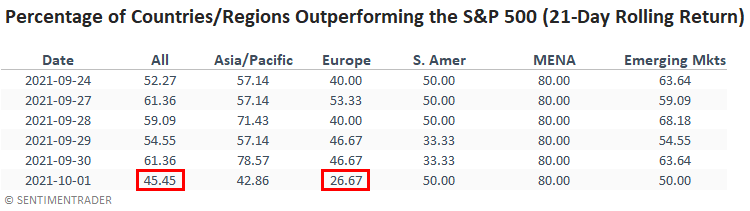
In a note on 7/7/21, I shared a study that assessed the forward return outlook for stocks when the percentage of countries outperforming the S&P 500 on a rolling 21-day basis falls to a low level. Here's a snapshot of the indicator broken down by worldwide regions.
Asia, and Europe, the two largest regions by country count, showed a decline in the percentage of ETFs outperforming the S&P 500 on a rolling 21-day basis.
GLOBAL BREADTH
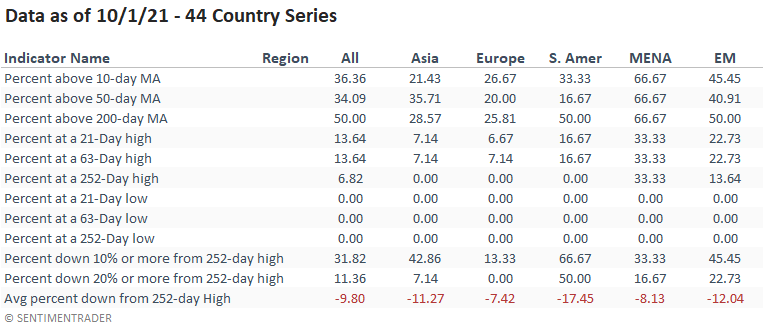
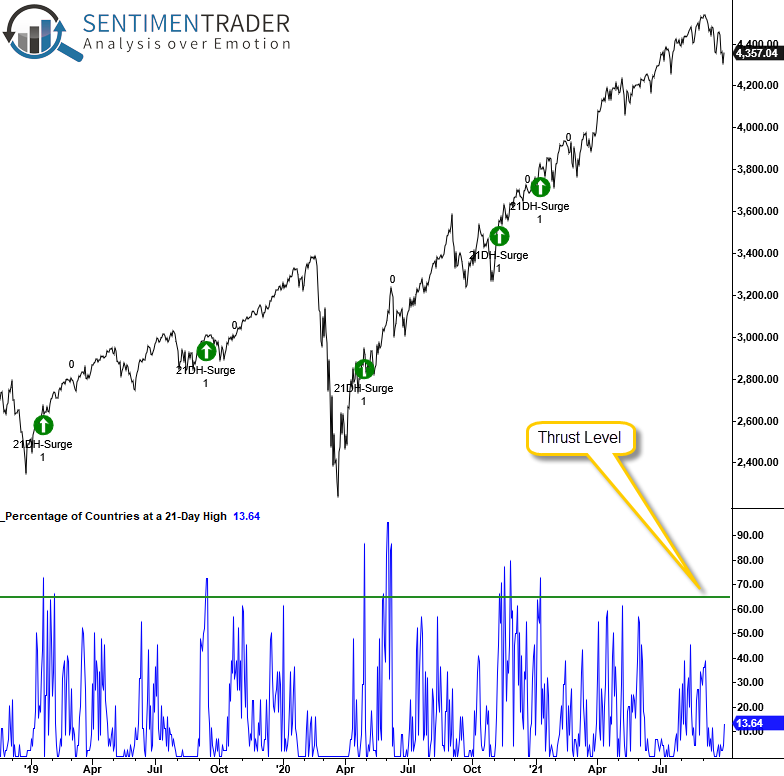
The percentage of countries registering a 21-day high showed fewer countries keeping up with large-cap domestic stocks as the index continued to close at a new high-a classic divergence pattern.
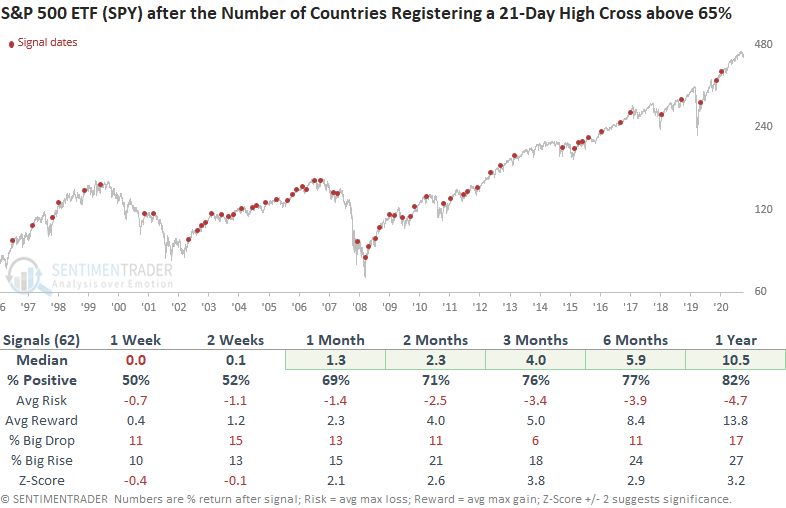
With the market in a drawdown phase, I will be watching this indicator for a surge in participation. Historically, a cross above 65% provides an excellent intermediate to long-term signal.
HOW THE SIGNALS PERFORMED
ABSOLUTE AND RELATIVE TREND COLUMN DEFINITIONS
- Absolute Trend Count Score - The absolute trend model contains ten indicators to assess absolute trends across several durations.
- Absolute Trend 5-Day Change - This indicator measures the 5-day net change in the absolute trend model.
- Relative Trend Count Score - The relative trend model contains ten indicators to assess relative trends vs. the S&P across durations.
- Relative Trend 5-Day Change - This indicator measures the 5-day net change in the relative trend model.
- Relative High Count - This indicator measures the number of 21-day relative highs vs. the S&P 500 in the last 5 days.
- Relative Low Count - This indicator measures the number of 21-day relative lows vs. the S&P 500 in the last 5 days.
- Absolute and Relative Trend Scores range from 10 (Best) to -10 (Worst)
- MA Trend Cnt Above - This indicator counts the number of consecutive days above the 10-day moving average.
- MA Trend Cnt Below - This indicator counts the number of consecutive days below the 10-day moving average.
Please click here for a note with details on the construction of the composite trend model.