
Absolute & Relative Trend Update

The goal of today's note is to provide you with some insight into what I am seeing with my absolute and relative trend following indicators for domestic and international ETFs.
Data as of 10/29/21 close. All relative comparisons are versus the S&P 500 ETF (SPY). For absolute and relative indicator definitions, please scroll down to the end of the note.
KEY TAKEAWAYS:
- Mega-cap stocks influenced relative trend scores in a big way last week
- I would keep an eye on the clean energy sector as trends are improving
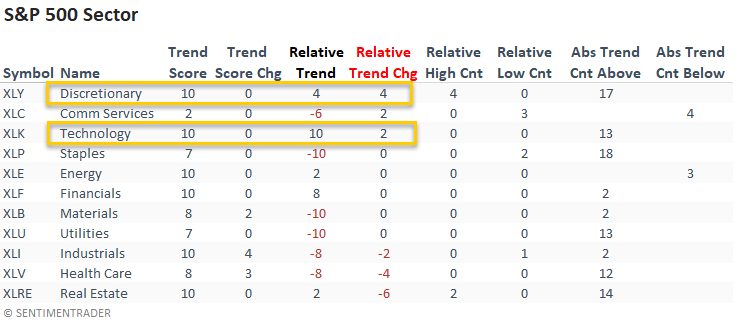
ABSOLUTE & RELATIVE TRENDS - SECTOR ETFS
The consumer discretionary sector had the best w/w relative trend score improvement. And, I would note that the group registered a new relative high on 4/5 days.
Technology continues to look good and returns to a perfect absolute and relative trend score profile.
Real estate registered two new relative highs last week before underperforming by a meaningful amount on Friday. The underperformance shifted the relative trend score down by six points.
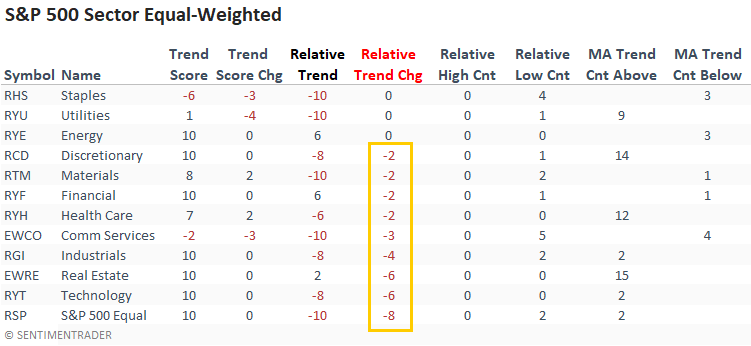
The equal-weighted sector data shows a meaningful deterioration, with 8/11 sectors registering a relative trend score decline. And, the relative trend score disconnect between several sectors is noteworthy, especially technology.
If we compare relative highs to relative lows, we see that lows outpaced highs by a considerable number.
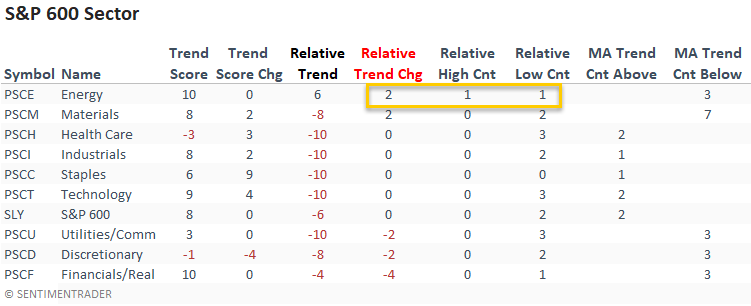
Interestingly, the small-cap energy and materials sectors registered small relative trend score gains last week. And, I would note that energy is the only sector with a positive relative trend score versus the S&P 500.
With the exception of energy, small-cap stocks continue to be in the penalty box until further notice.
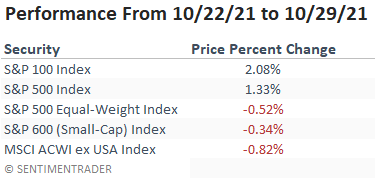
The glaring performance divide across market capitalizations and domestic versus foreign indexes was noteworthy last week.
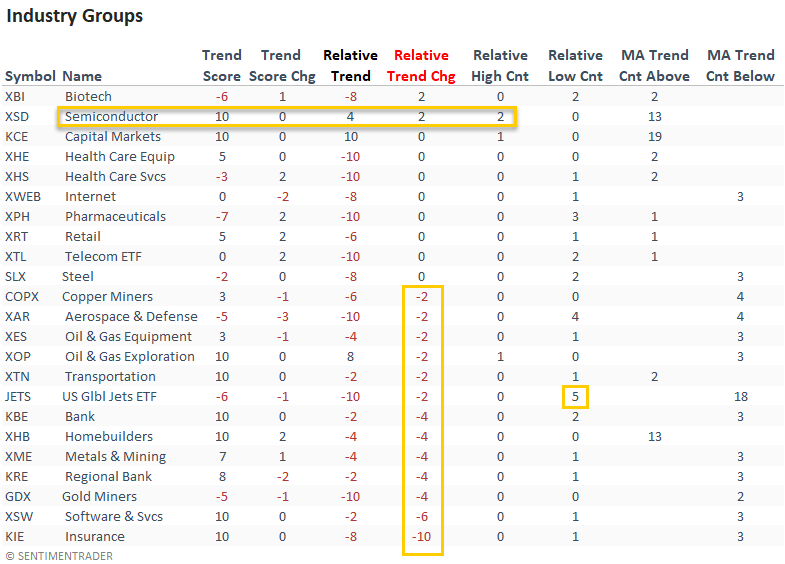
ABSOLUTE & RELATIVE TRENDS - INDUSTRIES
Suppose you sort the industry table according to the relative trend change. In that case, we see a meaningful decline across a broad spectrum of industries, with insurance being the most notable.
I would keep an eye on the Semiconductor ETF (XSD). Remember, it uses an equal-weighted index approach for constituent weightings.
ABSOLUTE & RELATIVE TRENDS - THEMATIC ETFS
Suppose you sort the thematic ETF table according to the relative trend change column. In that case, we see relative trend score gains from ETFs in the clean energy ecosystem.
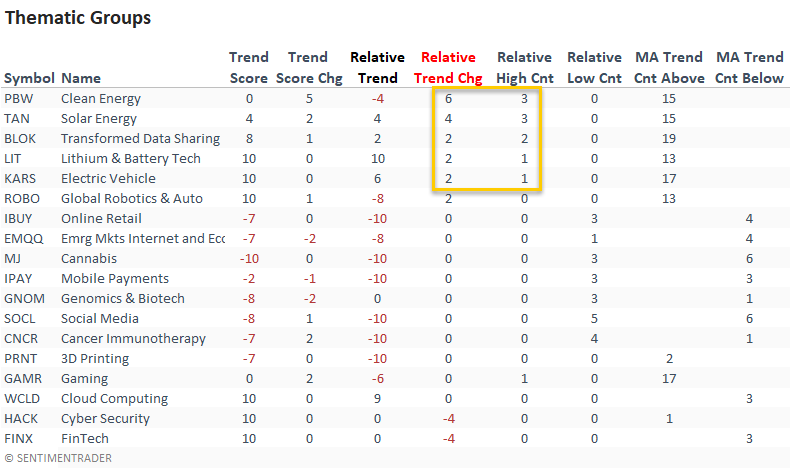
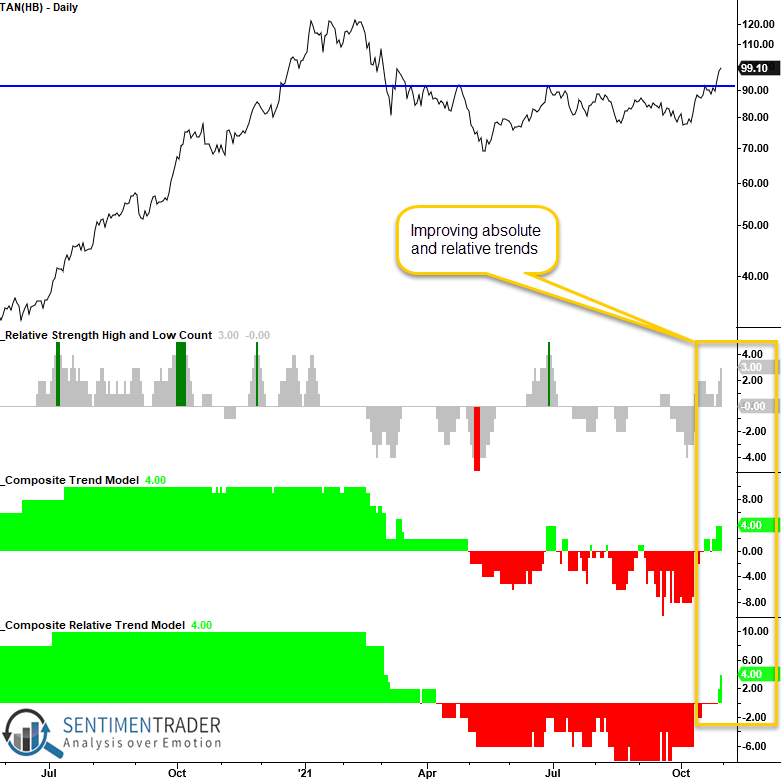
CHART IN FOCUS - SOLAR ENERGY
The solar ETF (TAN) closed above a 7-month long resistance level last week. With improving absolute and relative trends, I would keep this ETF on my watch list.
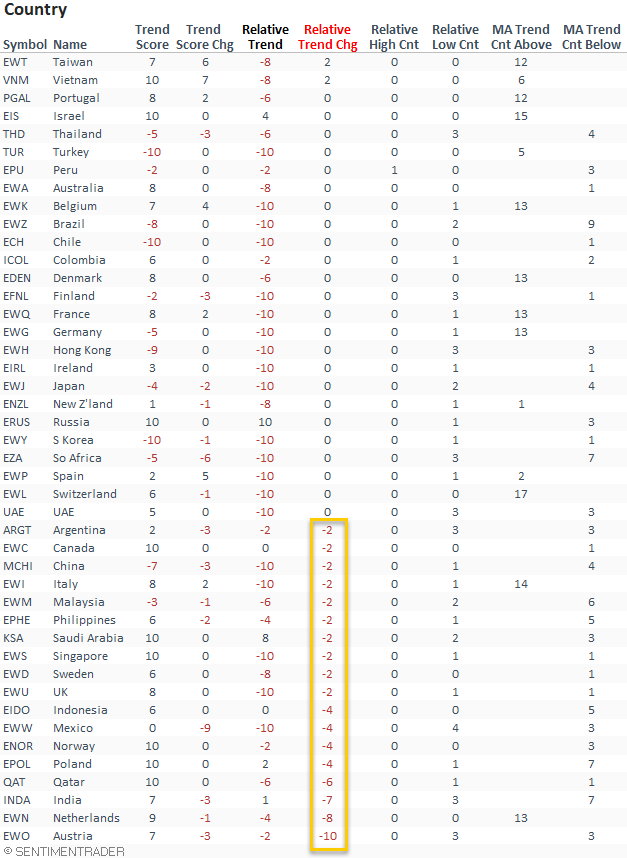
ABSOLUTE & RELATIVE TRENDS - COUNTRIES
Suppose I sort the Country table by the relative trend score change column. In that case, it shows a deterioration from a significant number of countries. India, Austria, and the Netherlands were the most notable.
I would keep an eye on India as the country had been one of the brighter spots in the emerging market space.
If we compare relative highs to relative lows, we see that lows outpaced highs by a considerable number.
GLOBAL RELATIVE TRENDS
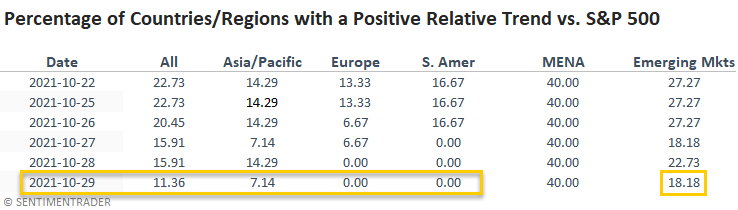
The percentage of countries with a positive relative trend score versus the S&P 500 declined on a w/w basis. If we look at the regional data, we see deterioration across the globe.
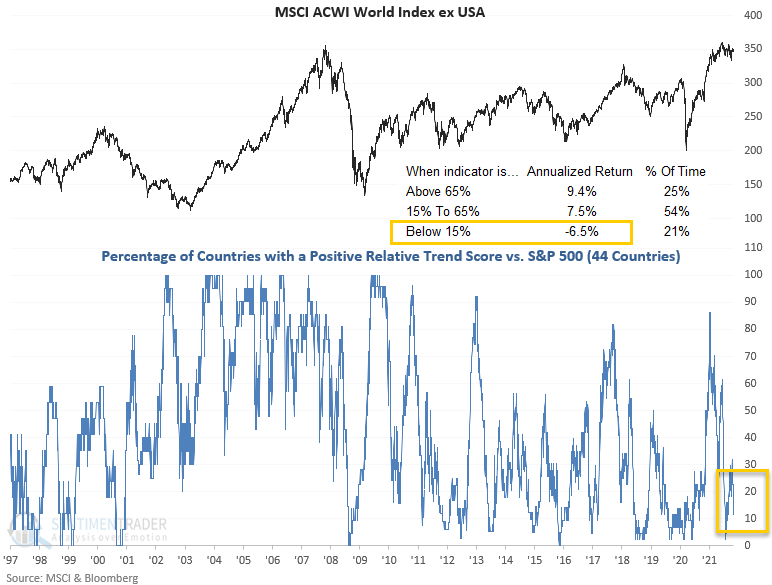
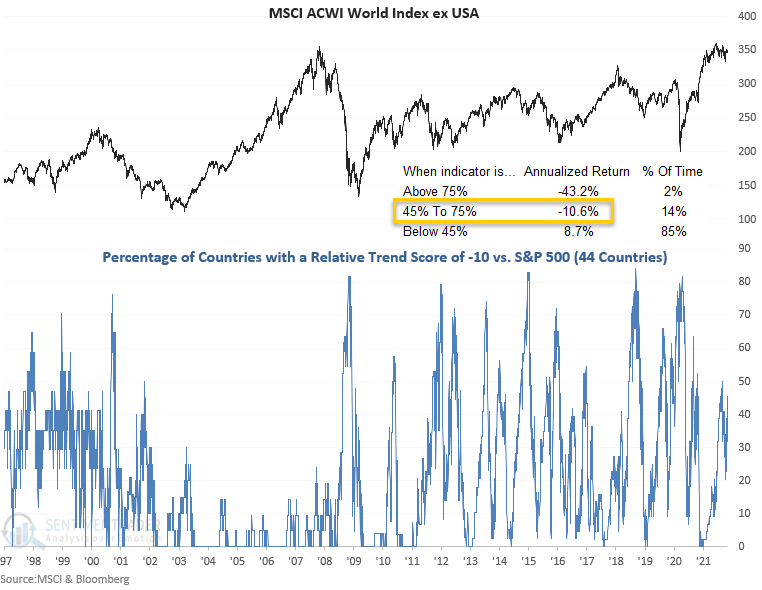
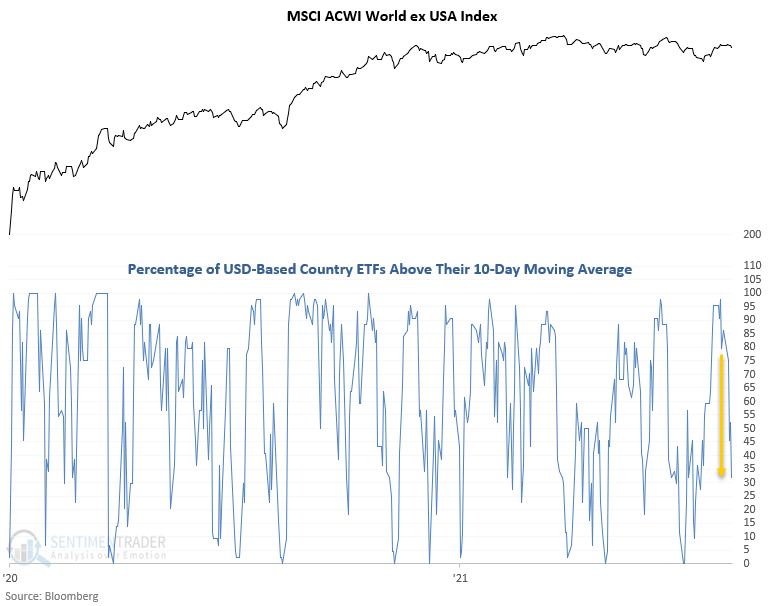
The current all-country data continues to suggest an unfavorable environment for the MSCI ACWI World Index ex USA.
ALL COUNTRY RELATIVE TREND CHART
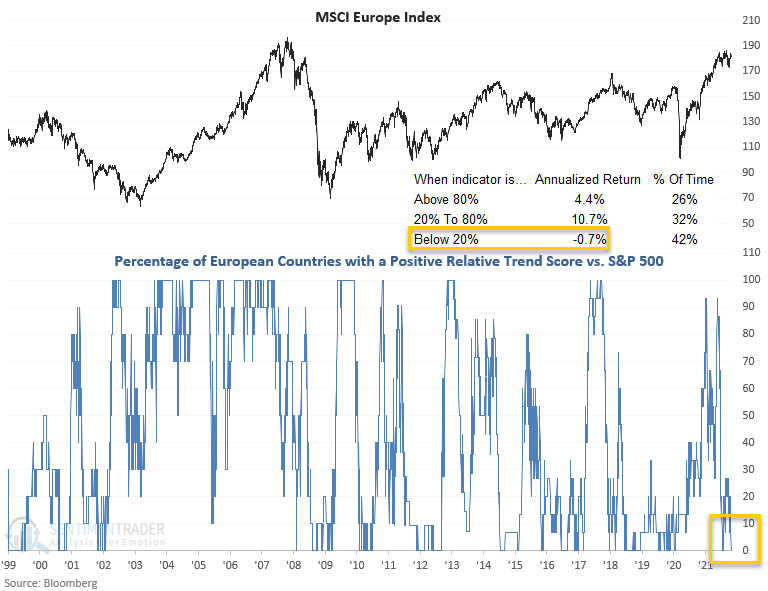
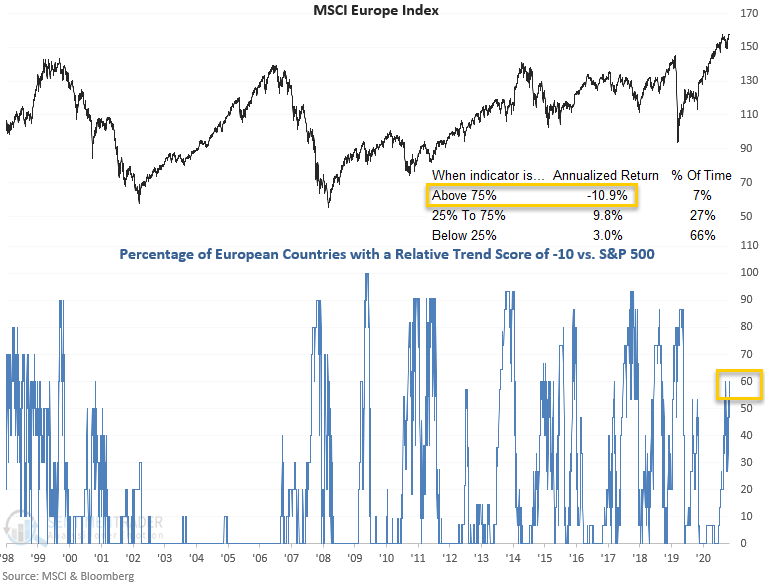
The percentage of Eurozone countries with a positive relative trend score versus the S&P 500 dropped to zero for the first time since July.
The percentage of countries with a relative trend score of -10 increased by a meaningful amount on a w/w basis. The deterioration was widespread around the globe.
China, Japan, Singapore, Italy, United Kingdom, Mexico, UAE, and South Africa fell to a -10 relative trend score.
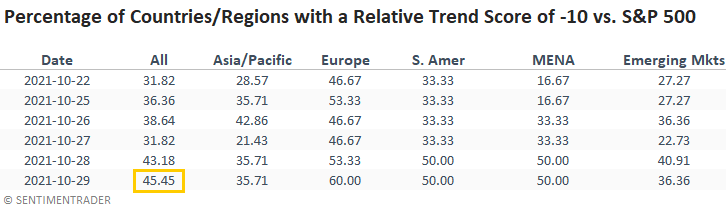
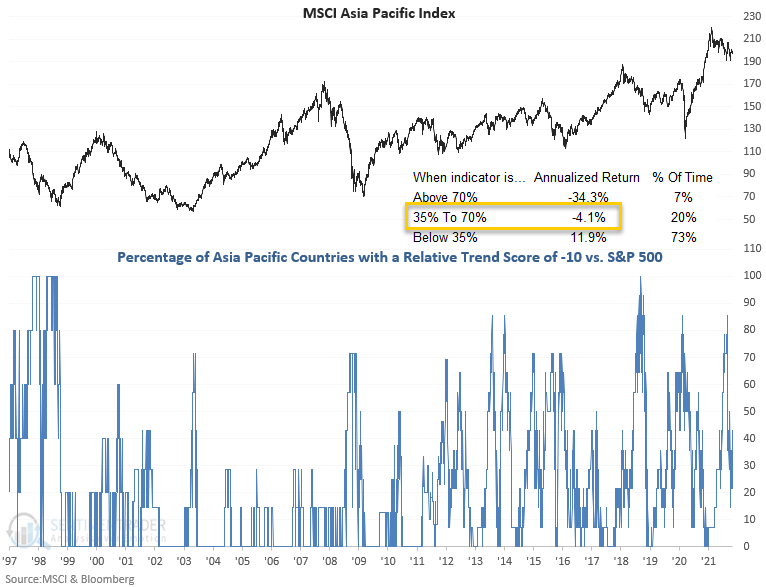
The percentage of countries in the Asia Pacific region with a relative trend score of -10 increased on a w/w basis. The current level suggests that one should be mindful of potentially lower returns for the MSCI Asia Pacific index.
I think this is a must-watch indicator on a go-forward basis as the supply chain and shipping bottlenecks impact economies around the globe.
The percentage of countries in the Eurozone region with a relative trend score of -10 increased to the highest level since 9/20/21. Historically, a level above 75% produces negative returns for MSCI Europe Index.
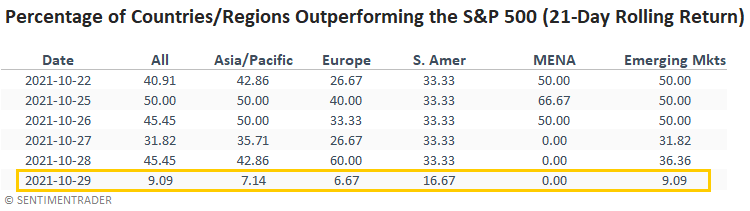
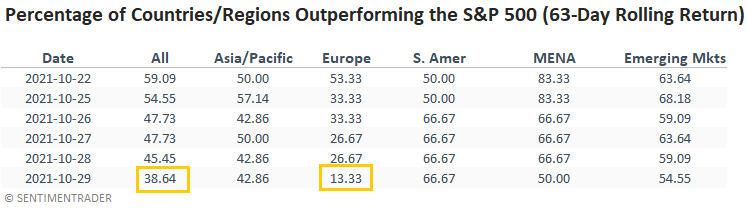
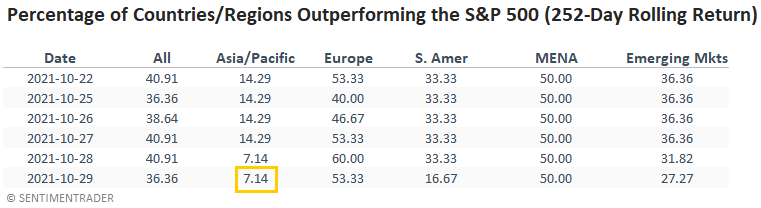
In a note on 7/7/21, I shared a study that assessed the forward return outlook for stocks when the percentage of countries outperforming the S&P 500 on a rolling 21-day basis falls to a low level. I've included a snapshot of the indicator from the original study and two additional tables with different rolling periods.
The percentage of countries outperforming the S&P 500 on a rolling 21-day basis declined by a meaningful amount on Friday. Take note.
GLOBAL BREADTH
Global participation amongst USD-based country ETFs had been improving until last week.
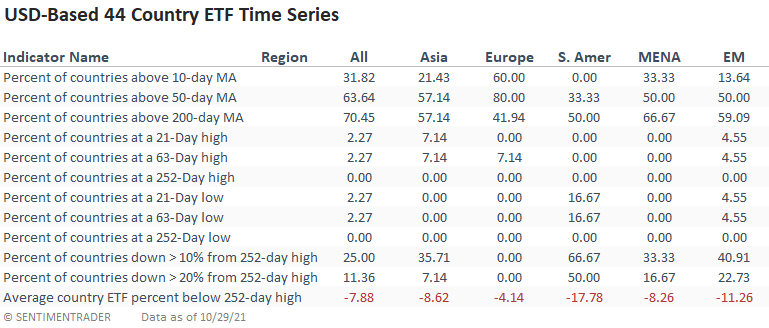
So far, the sharp drop in participation is limited to short-duration indicators like the percentage of countries above their respective 10-day moving average. New lows across all durations are nonexistent.
ABSOLUTE AND RELATIVE TREND COLUMN DEFINITIONS
- Absolute Trend Count Score - The absolute trend model contains ten indicators to assess absolute trends across several durations.
- Absolute Trend 5-Day Change - This indicator measures the 5-day net change in the absolute trend model.
- Relative Trend Count Score - The relative trend model contains ten indicators to assess relative trends vs. the S&P across durations.
- Relative Trend 5-Day Change - This indicator measures the 5-day net change in the relative trend model.
- Relative High Count - This indicator measures the number of 21-day relative highs vs. the S&P 500 in the last 5 days.
- Relative Low Count - This indicator measures the number of 21-day relative lows vs. the S&P 500 in the last 5 days.
- Absolute and Relative Trend Scores range from 10 (Best) to -10 (Worst)
- MA Trend Cnt Above - This indicator counts the number of consecutive days above the 10-day moving average.
- MA Trend Cnt Below - This indicator counts the number of consecutive days below the 10-day moving average.
Please click here for a note with details on the construction of the composite trend model.