
Absolute & Relative Trend Update

The goal of today's note is to provide you with some insight into what I am seeing with my absolute and relative trend following indicators for domestic and international ETFs.
Data as of 7/2/21 close. All relative comparisons are versus the S&P 500 ETF (SPY). For absolute and relative indicator definitions, please scroll down to the end of the note.
I added the consecutive days above or below the 10-day moving average count to the indicator tables. Please click here for a trading signal based on the moving average trend count concept.
ABSOLUTE & RELATIVE TRENDS - SECTOR ETFS
The relative trend score for the technology sector improved with an increase of six points on a week-over-week basis. Short-term price momentum is strong, with the sector closing above its 10-day moving average for 21 consecutive days. The improvement in the growth-oriented technology sector came at the expense of value-oriented groups like energy, industrials, and materials.
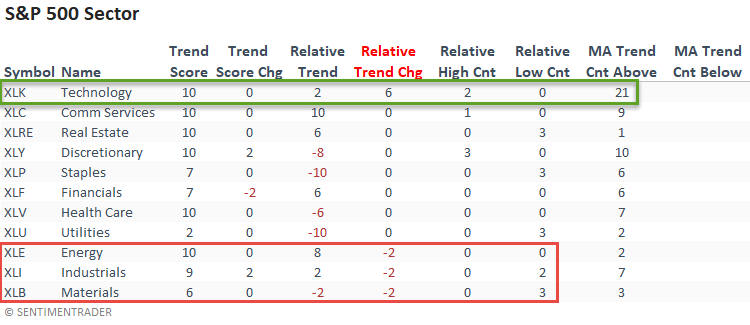
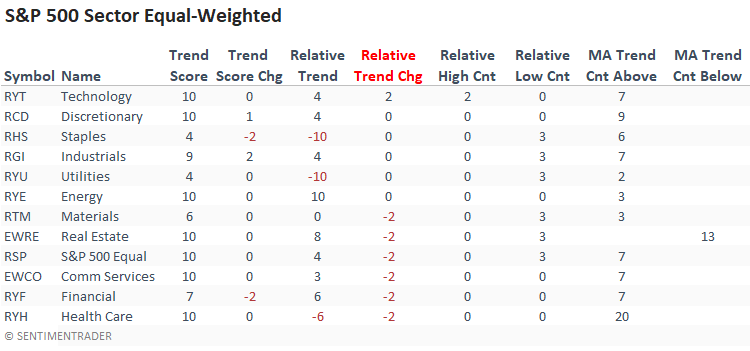
The equal-weighted relative sector trend change column shows some slight deterioration across a broader collection of groups. Technology improved, but the relative trend increase was not as pronounced as the cap-weighted version.
The small caps deteriorated on an absolute and relative basis last week. Trading on Friday was noteworthy as the Russell 2000 was down 1.01%, as the S&P 500 closed up 0.76%. When I assessed the difference using 0.75% for the S&P 500 and -1.0% for the Russell, I found only ten other instances since 1979. And, not a single one occurred when the S&P 500 traded at a new all-time high. All but one occurred within the context of a correction or bear market. What are the economically sensitive small caps trying to tell us?
STUDY IN FOCUS
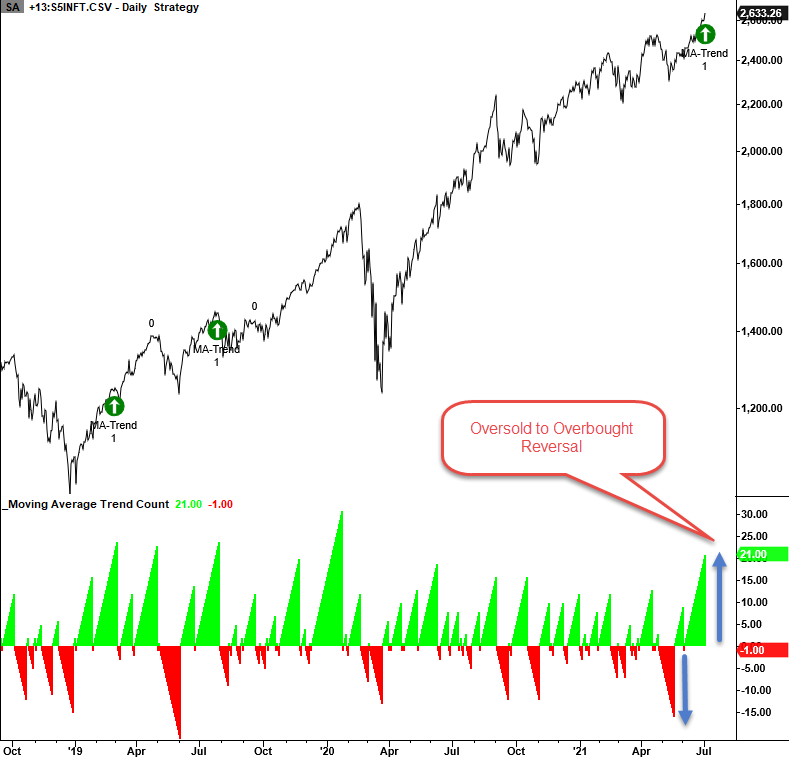
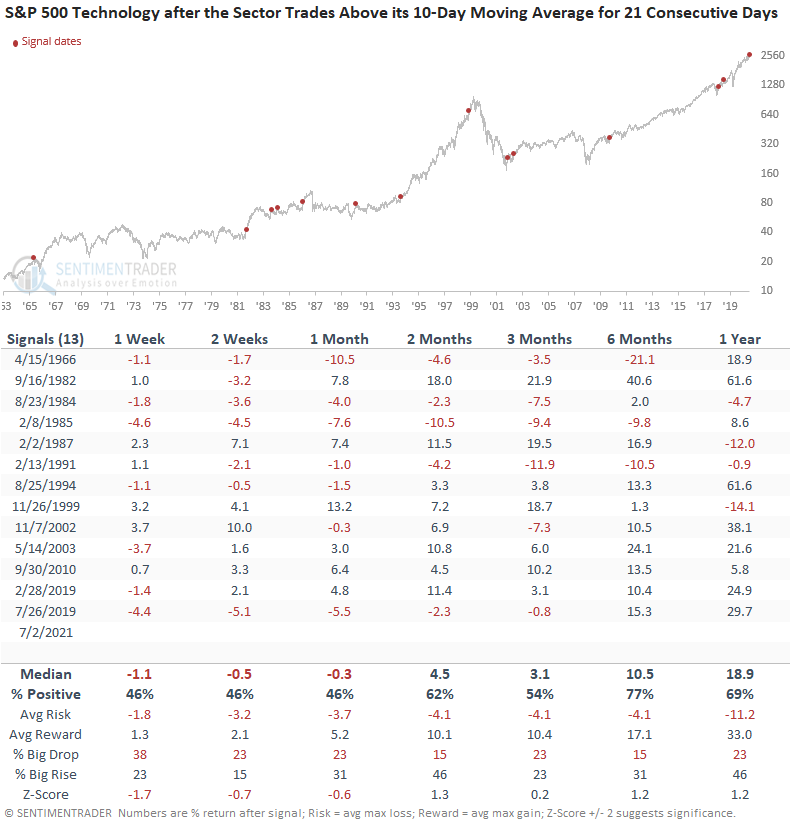
The S&P 500 technology sector has now traded above its 10-day moving average for 21 consecutive days. The chart and table below show other times when it reached this level after trading below its 10-day average for 15 consecutive days to show similar reversals.
HOW THE SIGNALS PERFORMED
The returns look weak in the short term with better, but not eye-catching, results starting in the 2-month timeframe.
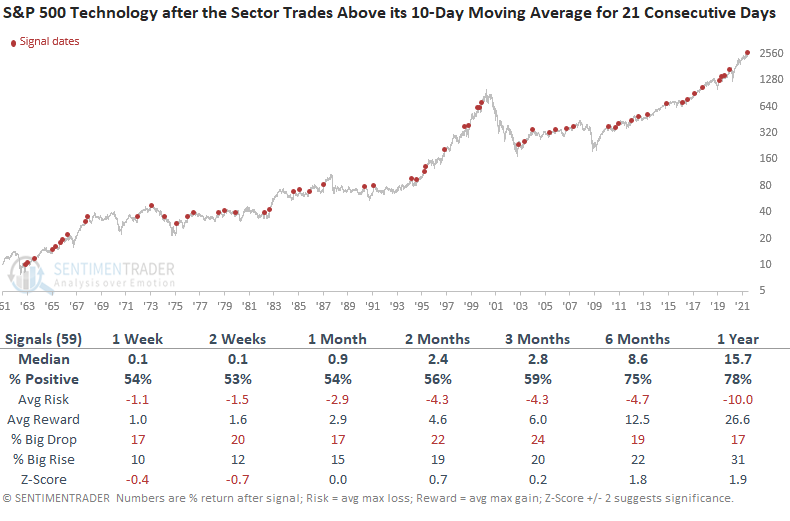
If you were wondering how technology performed after closing above its 10-day moving average for 21 consecutive days with no other signal criteria, here's performance since 1962. Results look a little better, but nothing stands out.
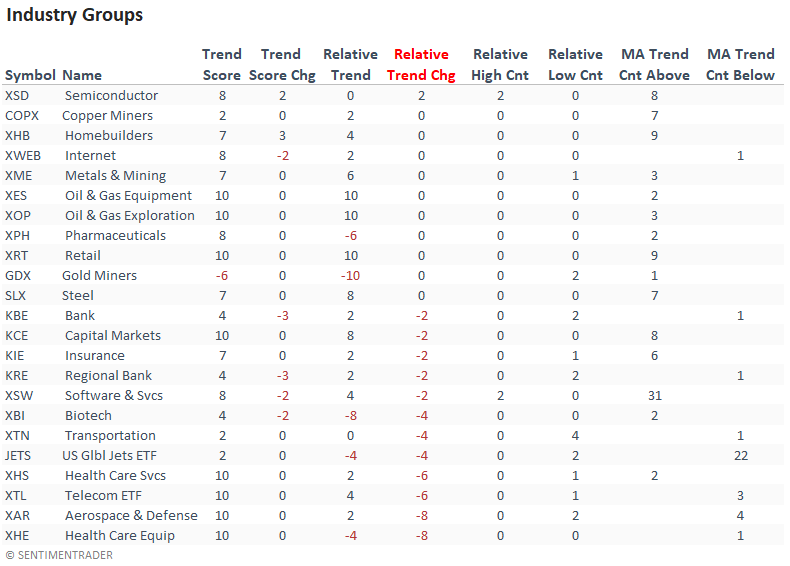
ABSOLUTE & RELATIVE TRENDS - INDUSTRIES
The relative trend change column shows significantly more industries with a deteriorating relative trend score versus an improving one. In an intraday note on Friday, I highlighted the weak short-term momentum in the airlines. The relative trend score for the Aerospace and Defense industry ETF decreased by a substantial amount.
When I looked at the S&P 1500 Aerospace and Defense sub-industry group, the change in the relative trend score was even more pronounced as it dropped by 12 points on a w/w basis. Unfortunately, a quick study did not result in any meaningful information.
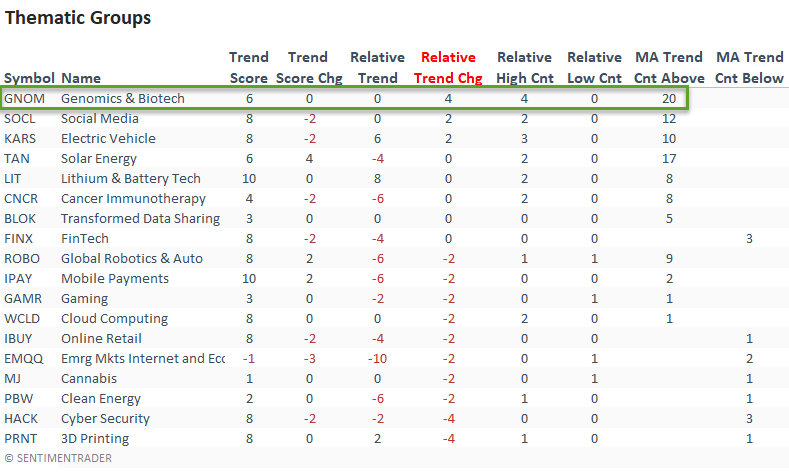
ABSOLUTE & RELATIVE TRENDS - THEMATIC ETFS
The thematic groups also show more deteriorating versus improving relative trend scores on a w/w basis. The Genomics & Biotech group is noteworthy as it registered a new relative high on 4/5 days.
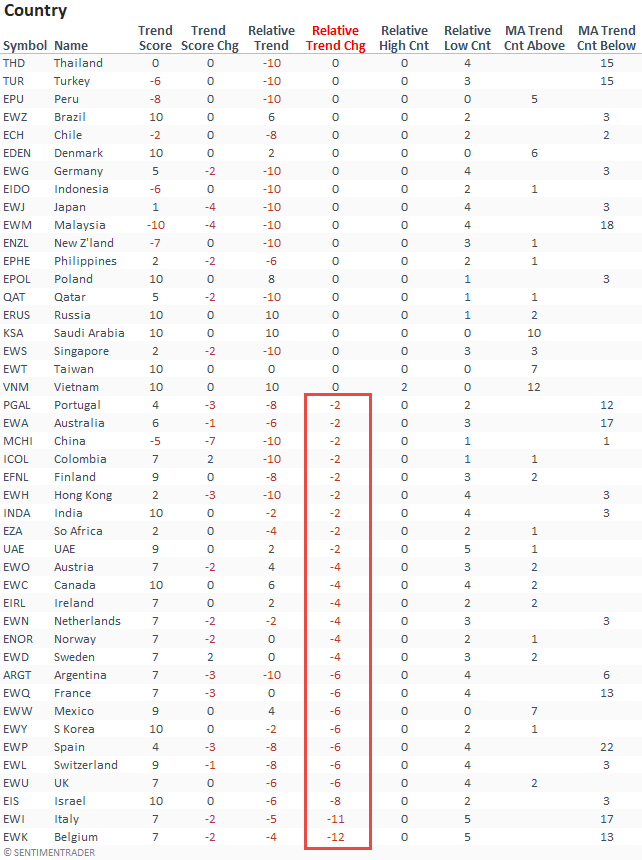
ABSOLUTE & RELATIVE TRENDS - COUNTRIES
Suppose I sort the Country table by relative trend change. In that case, it shows a significant number of countries with a deteriorating relative trend profile versus the S&P 500. While the slide was widespread across the globe, the Eurozone had several notable w/w declines. Vietnam remains strong and is the only country to register a new relative high last week.
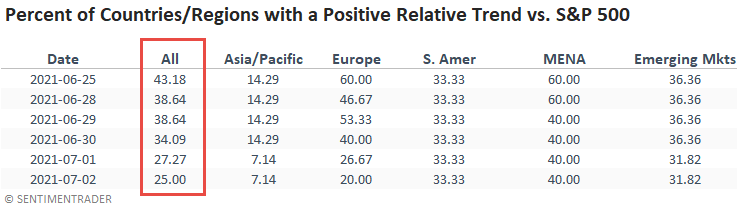
GLOBAL RELATIVE TRENDS
The percentage of countries with a positive relative trend score versus the S&P 500 decreased to a level that suggests flat to negative returns for regions around the globe.
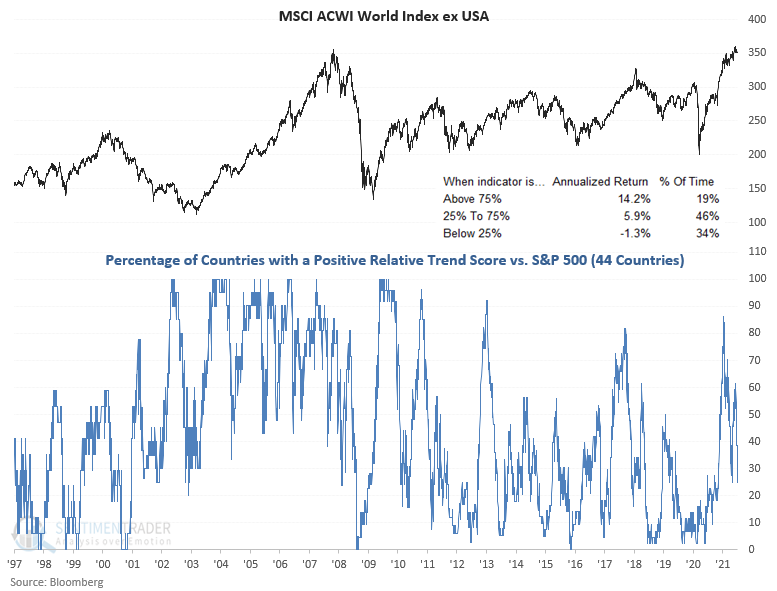
ALL COUNTRY RELATIVE TREND CHART
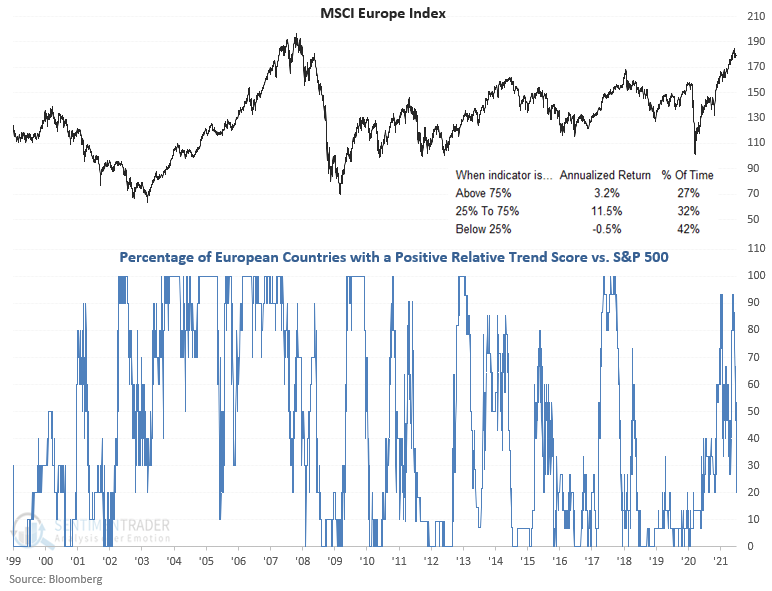
EUROPE RELATIVE TREND CHART
The percentage of European countries outperforming the S&P 500 dropped to a 9-month low.
ABSOLUTE AND RELATIVE TREND COLUMN DEFINITIONS
- Absolute Trend Count Score - The absolute trend model contains ten indicators to assess absolute trends across several durations.
- Absolute Trend 5-Day Change - This indicator measures the 5-day net change in the absolute trend model.
- Relative Trend Count Score - The relative trend model contains ten indicators to assess relative trends vs. the S&P across durations.
- Relative Trend 5-Day Change - This indicator measures the 5-day net change in the relative trend model.
- Relative High Count - This indicator measures the number of 21-day relative highs vs. the S&P 500 in the last 5 days.
- Relative Low Count - This indicator measures the number of 21-day relative lows vs. the S&P 500 in the last 5 days.
- Absolute and Relative Trend Scores range from 10 (Best) to -10 (Worst)
- MA Trend Cnt Above - This indicator counts the number of consecutive days above the 10-day moving average.
- MA Trend Cnt Below - This indicator counts the number of consecutive days below the 10-day moving average.