
Absolute & Relative Trend Update

The goal of today's note is to provide you with some insight into what I am seeing with my absolute and relative trend following indicators for domestic and international ETFs.
Data as of 8/6/21 close. All relative comparisons are versus the S&P 500 ETF (SPY). For absolute and relative indicator definitions, please scroll down to the end of the note.
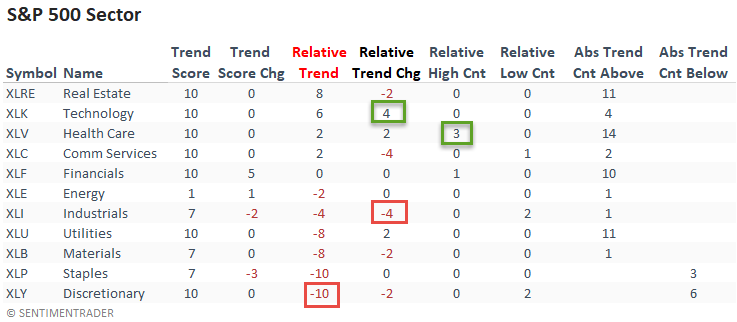
ABSOLUTE & RELATIVE TRENDS - SECTOR ETFS
The relative trend score for the health care sector continues to gain strength. And, it registered a new 1-month relative high on 3/5 days last week. On a w/w basis, Technology had the best trend change score whereas Industrials showed the most significant decline.
Real Estate lost a little ground on a relative basis. However, it still maintains the best combination of absolute and relative trends.
Keep an eye on the discretionary sector.
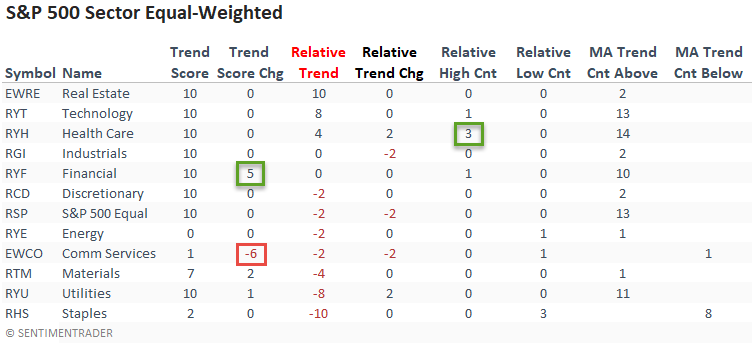
The equal-weighted health care sector confirmed the improving relative trend in the large-cap data. And, the group also registered a new relative high on 3/5 days.
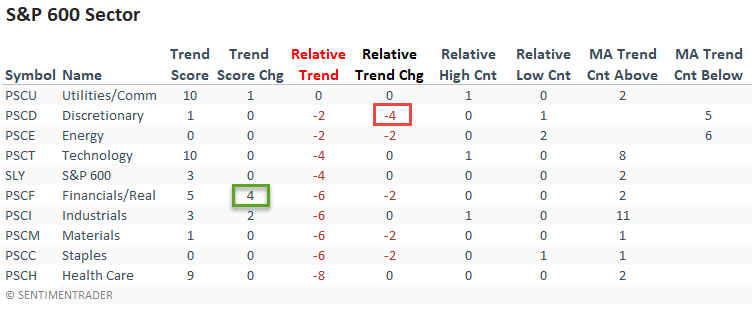
The small-cap consumer discretionary sector followed the other discretionary groups with a decline in its relative trend score on a w/w basis.
The weight-of-the-evidence continues to suggest that small caps are in the penalty box until further notice.
MIND THE OPPORTUNITY
In a note last week, I mentioned the importance of selecting the appropriate ETFs for the ATR spread trading signal. Whether you're a trader or investor, it's always important to understand where opportunity is abundant. I keep track of the following large-cap sector table as a reminder.
ABSOLUTE & RELATIVE TRENDS - INDUSTRIES
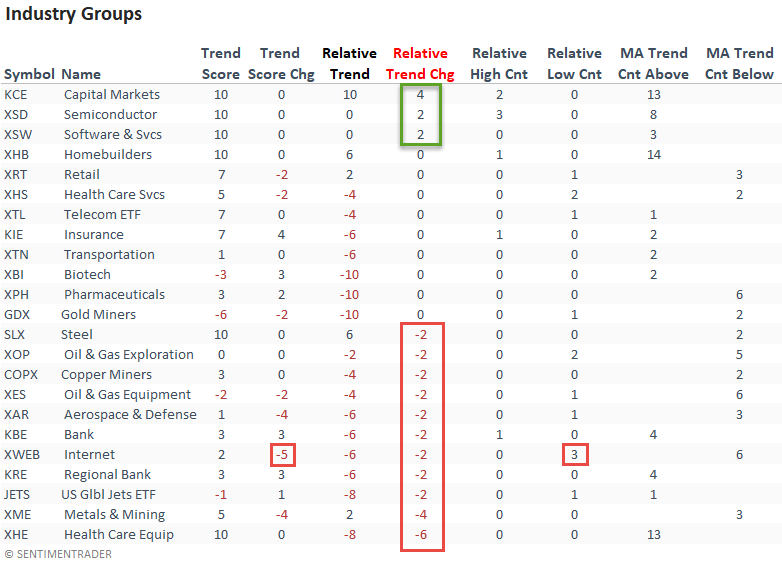
The capital markets ETF registered a four-point jump in its respective relative trend score and now maintains the only perfect absolute and relative scores amongst the industry groups.
The equal-weighted Semiconductor ETF (XSD) registered a new relative high on 3/5 days and now is less than 1.5% from a new high. The current consolidation stands at 120 days.
ABSOLUTE & RELATIVE TRENDS - THEMATIC ETFS
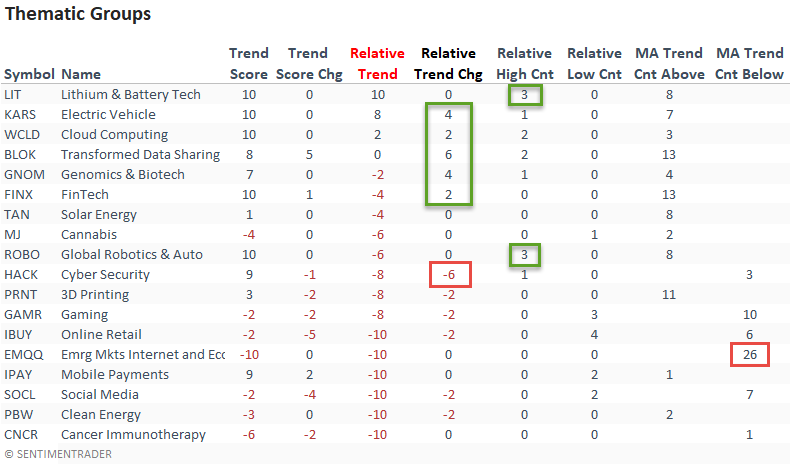
The Lithium and Battery Technology and Electric Vehicle ETFs continue to stand out in the thematic group. I would note the jump in the relative trend score for the Transformed Data Sharing ETF, a proxy for bitcoin.
ABSOLUTE & RELATIVE TRENDS - COUNTRIES
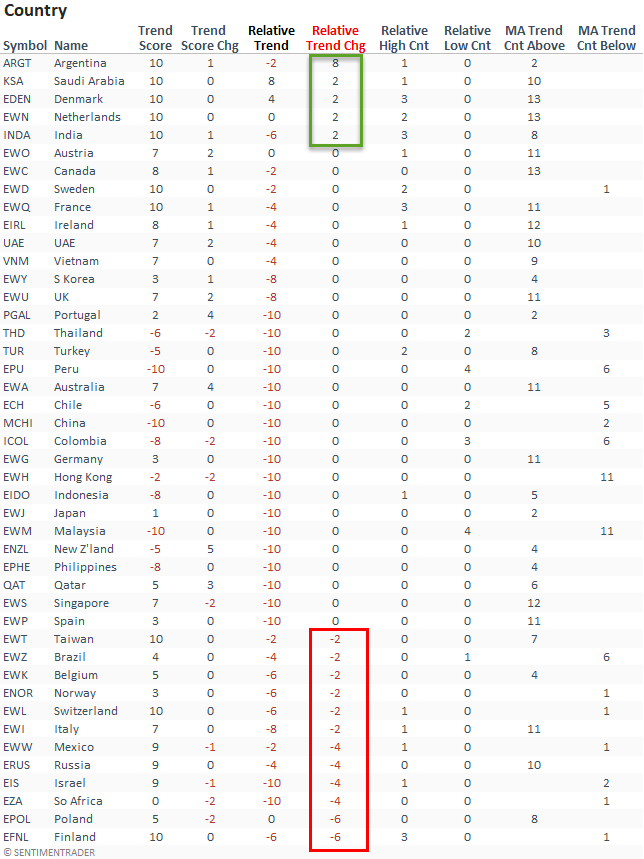
Suppose I sort the Country table by the relative trend score change column. In that case, it shows more countries with a deterioration in their respective relative trend scores versus an improvement on a w/w basis. The percentage of countries with a relative trend score of -10 ticked up slightly and continues to reside at a level that suggests negative forward returns for a broad-based global allocation.
GLOBAL RELATIVE TRENDS
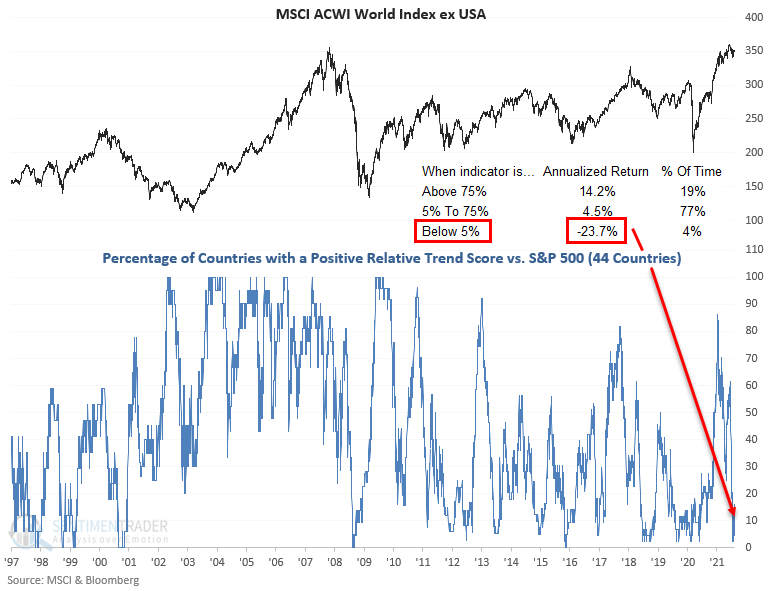
The percentage of countries with a positive relative trend score versus the S&P 500 deteriorated on a w/w basis. The current level suggests an unfavorable environment for the MSCI ACWI World Index ex USA.
ALL COUNTRY RELATIVE TREND CHART
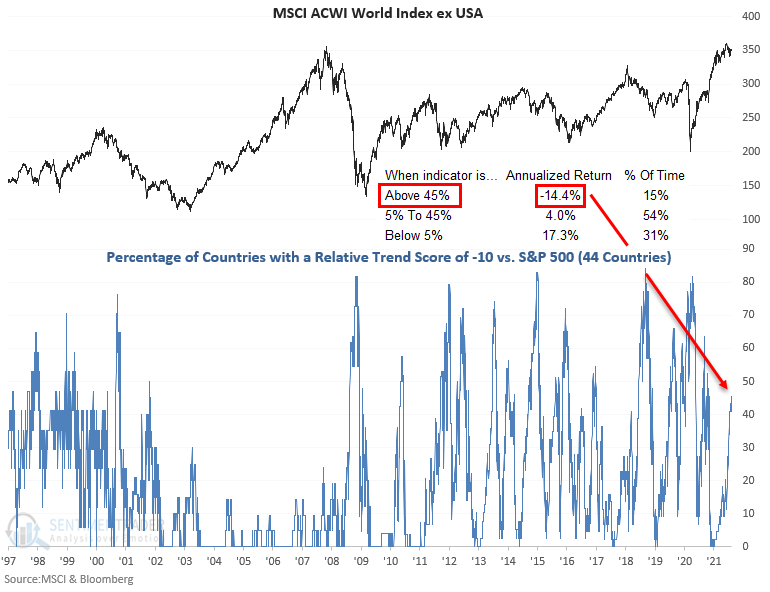
The percentage of countries with a relative trend score of -10 versus the S&P 500 remains at a level that suggests negative returns for the MSCI ACWI World Index ex USA.
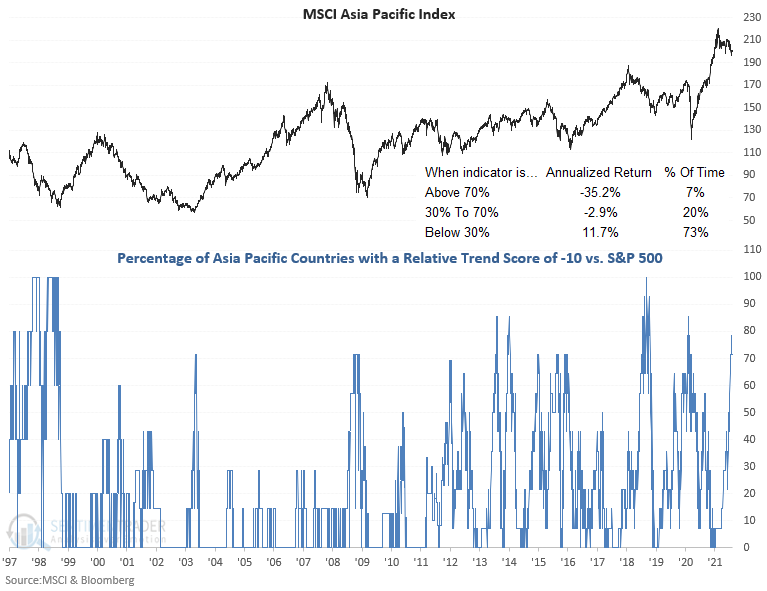
The percentage of countries in the Asia Pacific region with a relative trend score of -10 remains at a level that is concerning.
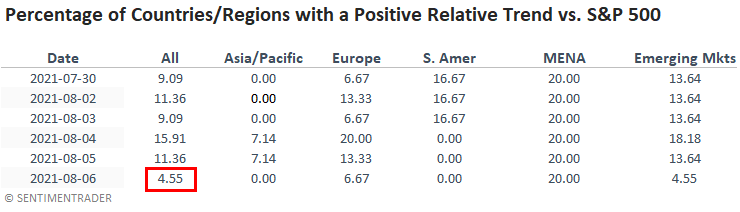
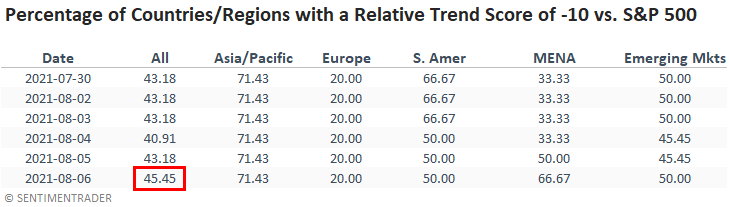
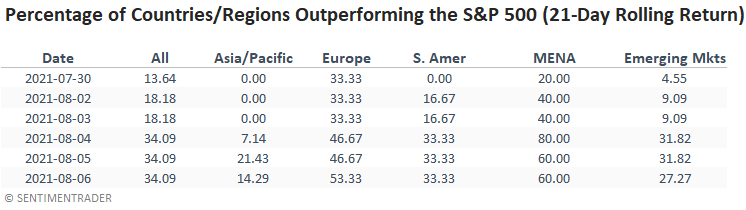
In a note on 7/7/21, I shared a study that assessed the forward return outlook for stocks when the percentage of countries outperforming the S&P 500 on a rolling 21-day basis falls to a low level. Here's a snapshot of the indicator broken down by worldwide regions.
Several regions are showing short-term improvement. I would note that the percentages could diverge from the relative trend values as the calculations use different durations.
ABSOLUTE AND RELATIVE TREND COLUMN DEFINITIONS
- Absolute Trend Count Score - The absolute trend model contains ten indicators to assess absolute trends across several durations.
- Absolute Trend 5-Day Change - This indicator measures the 5-day net change in the absolute trend model.
- Relative Trend Count Score - The relative trend model contains ten indicators to assess relative trends vs. the S&P across durations.
- Relative Trend 5-Day Change - This indicator measures the 5-day net change in the relative trend model.
- Relative High Count - This indicator measures the number of 21-day relative highs vs. the S&P 500 in the last 5 days.
- Relative Low Count - This indicator measures the number of 21-day relative lows vs. the S&P 500 in the last 5 days.
- Absolute and Relative Trend Scores range from 10 (Best) to -10 (Worst)
- MA Trend Cnt Above - This indicator counts the number of consecutive days above the 10-day moving average.
- MA Trend Cnt Below - This indicator counts the number of consecutive days below the 10-day moving average.