
Absolute & Relative Trend Update

The goal of today's note is to provide you with some insight into what I am seeing with my absolute and relative trend following indicators for domestic and international ETFs.
Data as of 5/7/21 close. All relative comparisons are versus the S&P 500 ETF (SPY). For absolute and relative indicator definitions, please scroll down to the end of the note.
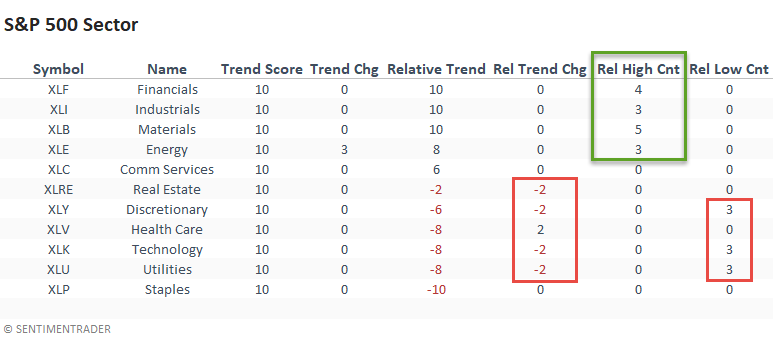
ABSOLUTE & RELATIVE TRENDS
The value/cyclical groups continue to exhibit robust relative trend scores. Financials industrials, materials, and energy dominated the relative high count last week, especially the materials sector, as it scored a new high on all five trading days. Technology and consumer discretionary showed some deterioration with relative lows on 3/5 trading days.
ABSOLUTE & RELATIVE TRENDS
The equal-weighted relative trend score and high count indicators confirm the cap-weighted strength in the value/cyclical groups. The consumer discretionary sector remains strong and continues to diverge from the cap-weighted version. AMZN is still weighing on the XLY ETF. The technology trend score dropped, and it registered three new relative lows last week.
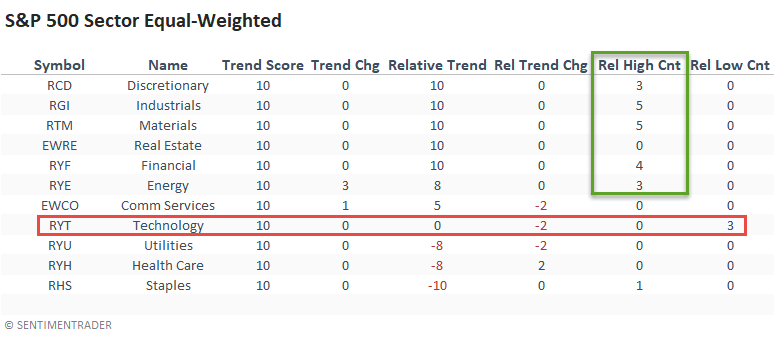
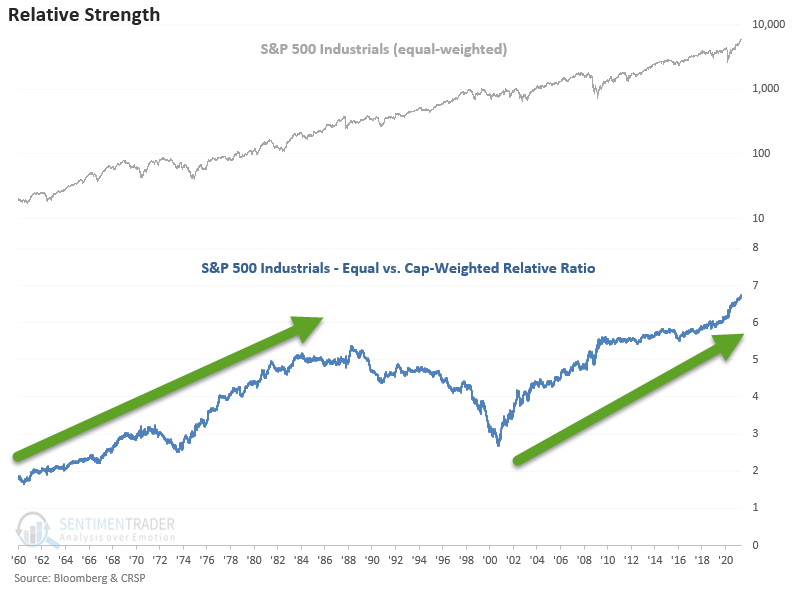
CHART IN FOCUS - S&P 500 INDUSTRIALS EQUAL vs. CAP-WEIGHTED
From a historical perspective, I would favor the equal-weighted industrials sector over the cap-weighted version, especially in the early stages of a new business cycle.
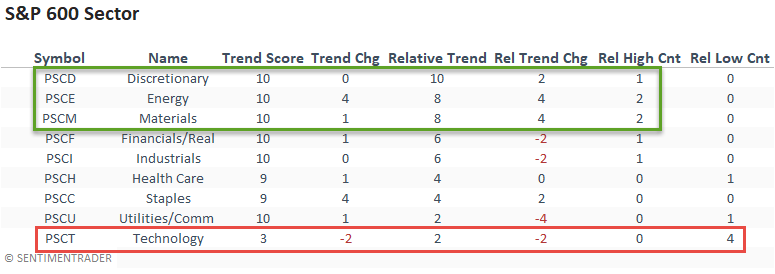
ABSOLUTE & RELATIVE TRENDS
The small-cap sector trends look similar to the large-cap equal-weighted groups. Strength in consumer discretionary, materials, and energy with deteriorating trends in technology.
ABSOLUTE & RELATIVE TRENDS
Energy and metals & mining joined the party with noticeable trend score changes and new relative highs. Within technology, the internet and software & services groups showed a meaningful decline in relative trend scores. Gold miners improved with the 2-month breakout in gold.
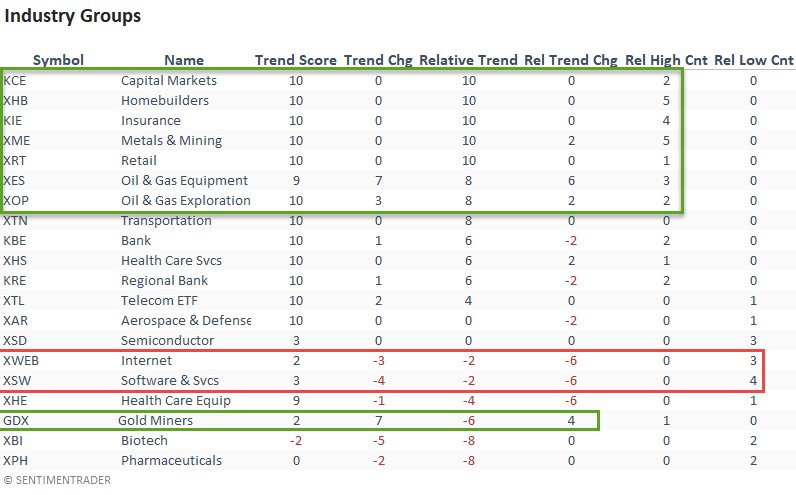
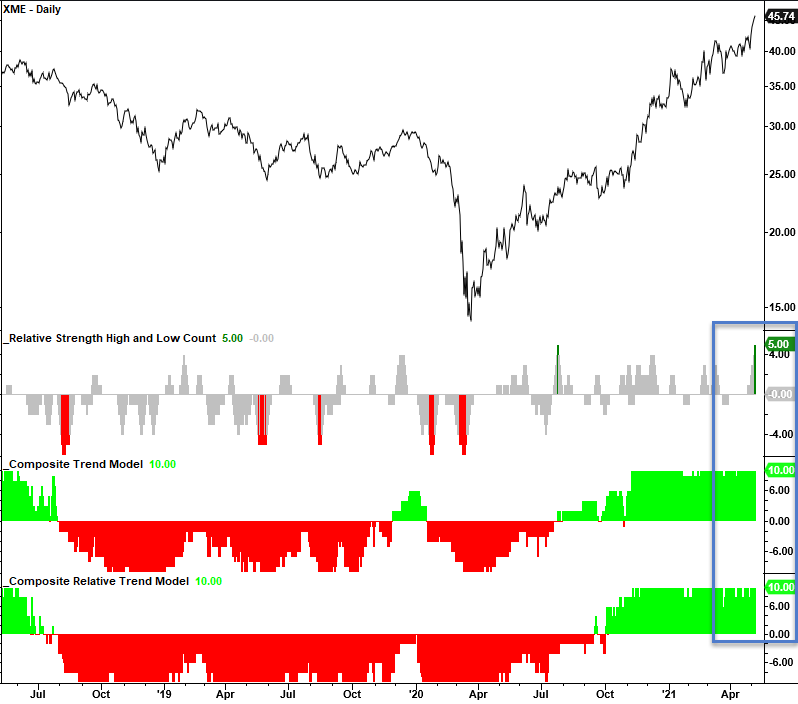
CHART IN FOCUS - METALS & MINING
ABSOLUTE & RELATIVE TRENDS
The thematic growth groups showed meaningful deterioration in absolute and relative trend scores. It's one thing to see negative relative trends in a bull market, but when absolute trends turn negative, one should take note.
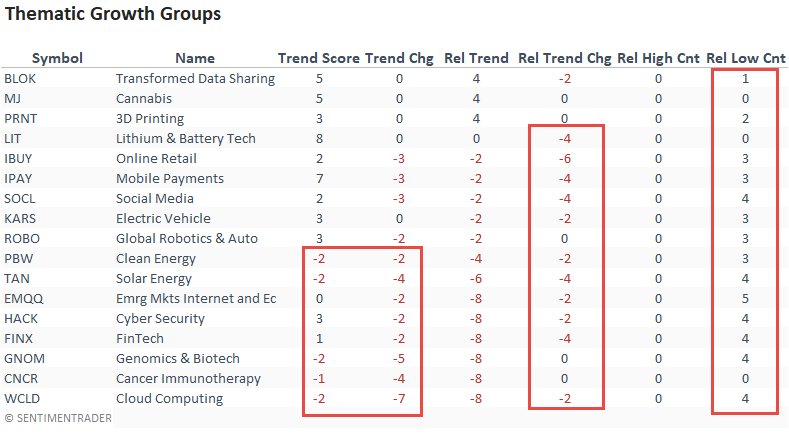
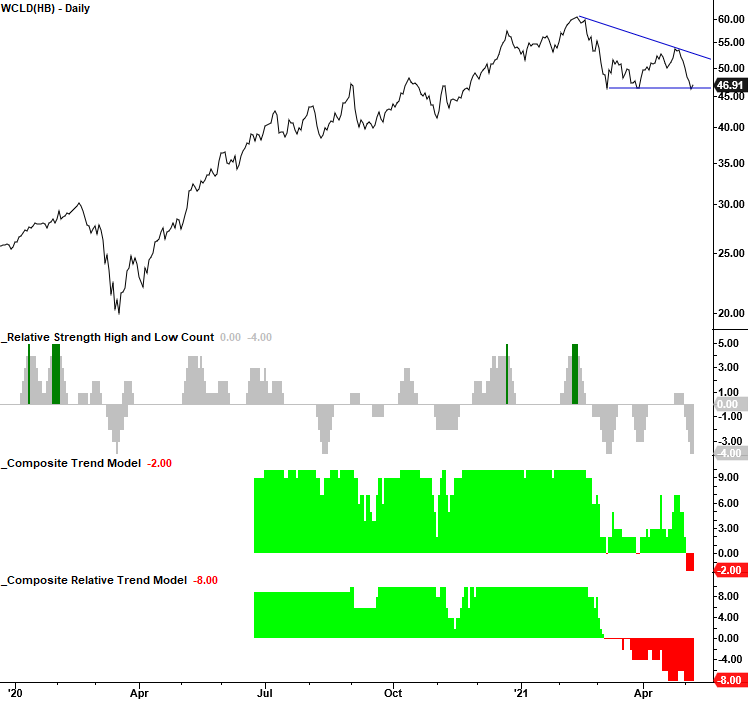
CHART IN FOCUS - CLOUD COMPUTING
The cloud computing stocks need to hold support around the current level.
ABSOLUTE & RELATIVE TRENDS
The international/country ETFs reversed higher from the previous week with several noticeable improvements, especially in Europe. The trend score in South Africa jumped 10 points. I suspect higher gold prices helped. China continues to exhibit weak trends and registered five consecutive relative lows last week.
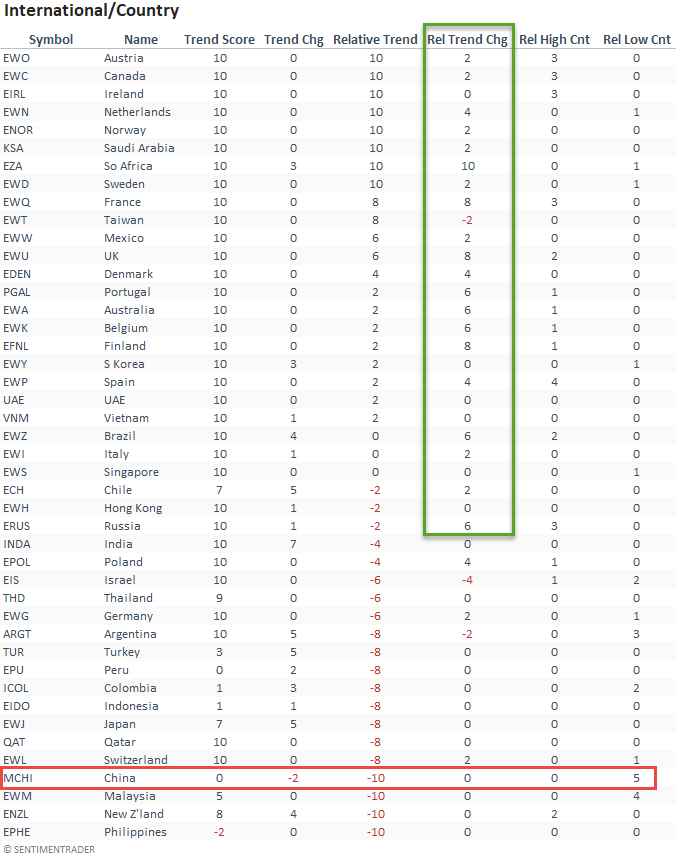
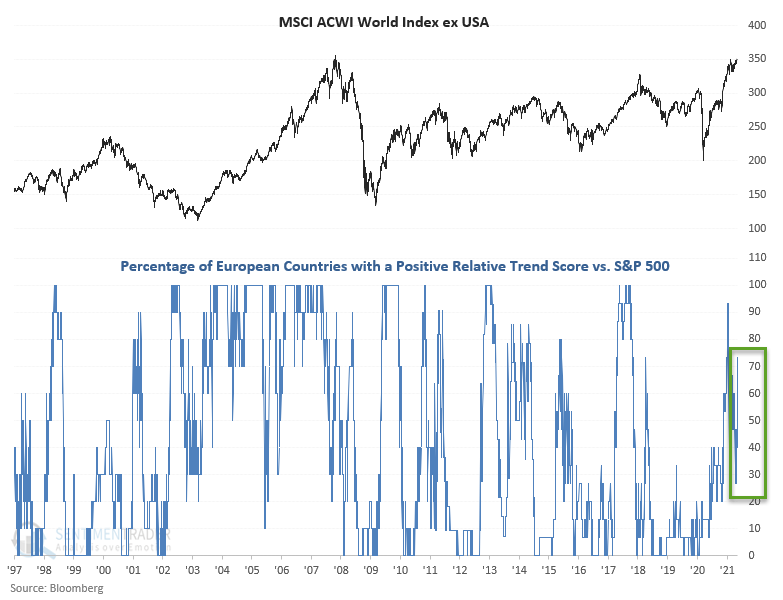
CHART IN FOCUS - EUROPEAN RELATIVE TRENDS
The following chart measures the percentage of European countries with a positive relative trend score versus the S&P 500. The indicator reversed higher last week and nows stands at 73%. With the strong performance in the value/cyclical groups last weak, a reversal in European ETFs is not a surprise as the holdings lean toward the factors mentioned above.
ABSOLUTE AND RELATIVE TREND COLUMN DEFINITIONS
1.) Absolute Trend Count Score - The absolute trend model contains ten indicators to assess absolute trends across several durations.
2.) Absolute Trend 5-Day Change - This indicator measures the 5-day net change in the absolute trend model.
3.) Relative Trend Count Score - The relative trend model contains ten indicators to assess relative trends across several durations. Relative to S&P 500.
4.) Relative Trend 5-Day Change - This indicator measures the 5-day net change in the relative trend model.
5.) Relative High Count - This indicator measures the number of 21-day relative highs versus the S&P 500 in the last 5 days.
6.) Relative Low Count - This indicator measures the number of 21-day relative lows versus the S&P 500 in the last 5 days.
Absolute and Relative Trend Scores - 10 (Best) to -10 (Worst)