
Adding emerging markets to models
Many asset allocation models incorporate some aspect of emerging markets. But since emerging markets have generally underperformed the U.S. stock market over the past 10 years, these models have mostly underperformed. This isn't necessarily an issue, since these models typically have some allocation to U.S. equities.
In fact, emerging markets are expected to underperform the U.S. from time to time. And by "time to time", these periods can last a long time.
One way to deal with this is to diversify between emerging markets and U.S. equities. That way, periods of emerging market underperformance will be offset by periods of emerging market outperformance.
Another way to deal with this is to "time" the relative performance between emerging markets and the U.S.
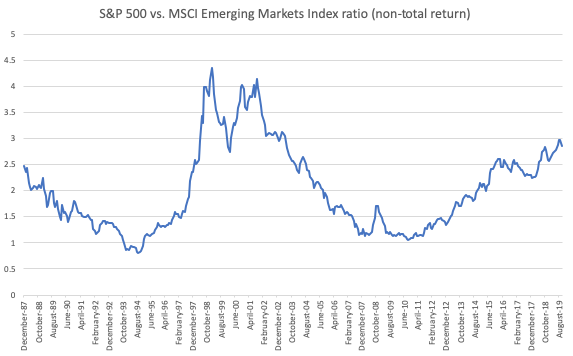
The following chart demonstrates the S&P 500 vs MSCI Emerging Markets Index ratio. As you can see, this ratio can trend in one direction for years:
We can use a simple 12 month moving average to time this ratio and improve our models' returns by adding an emerging markets component. Here's how.
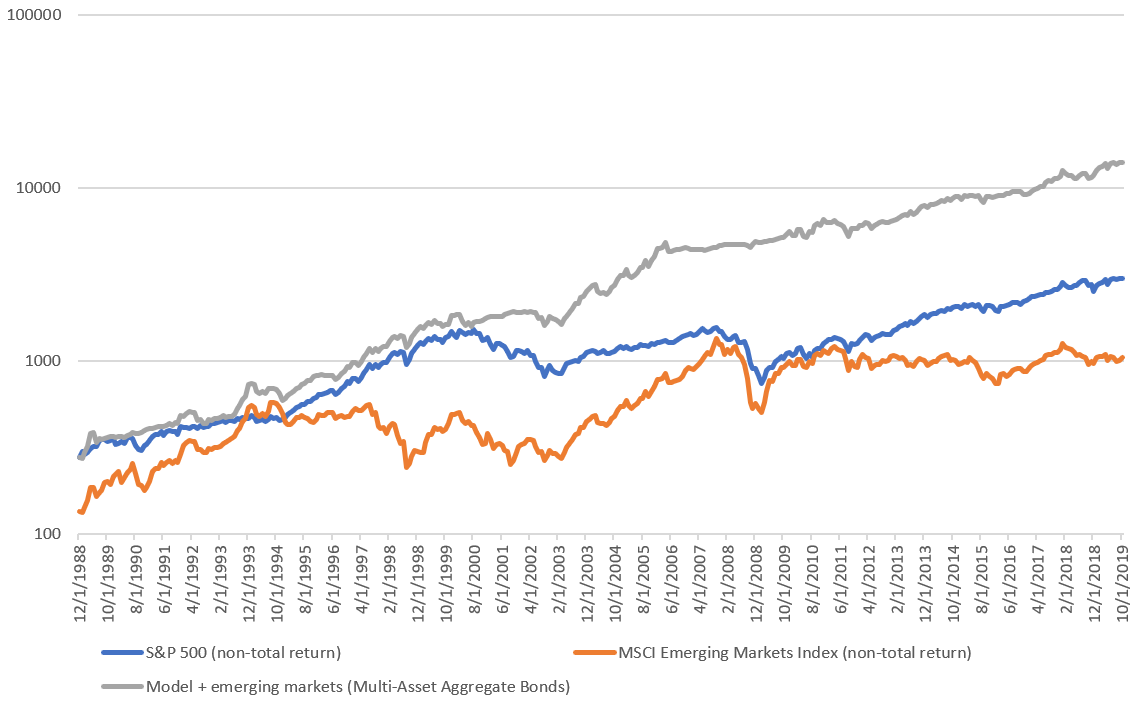
Macro Index Model + Emerging Markets
Here are the model's rules:
- If the Macro Index ≤ 0.7, SELL and don't buy stocks.
- If the Macro Index > 0.7…..
- If the MSCI Emerging Market Index's 12 month rate-of-change has exceeded the S&P 500's 12 month rate-of-change, go 100% long the MSCI Emerging Markets Index.
- Otherwise, go 100% long the S&P 500
*When you don't buy stocks, buy the Bloomberg Barclays U.S. Aggregate Bond Index
*Here's how to calculate the 12 month rate-of-change: e.g. if today is December 1, look at the index's % change from November of the previous year to November of this year.
Average annual returns
From December 1988 - September 2019:
- The original Macro Index has an average annual return of 11.30% per year
- Macro Index Model + Emerging Markets has an average annual return of 13.72% per year
*These returns don't include dividends reinvested. Including dividends reinvested, average annual returns would be higher.
Sharpe ratio
From December 1988 - September 2019:
- The original Macro Index Model has a Sharpe ratio of 0.62
- Macro Index Model + Emerging Markets has a Sharpe ratio of 0.78
*This Sharpe ratio is artificially low because it does not take into account dividends reinvested. Including dividends reinvested, Sharpe would be higher
Note
This isn't a huge improvement over the original Macro Index Model, because 2 of the periods in which emerging markets outperformed were late-1980s to first half of the 1990s, and 2002-2007. During these years, the Macro Index spent a considerable amount of time away from stocks (1990-1991 and 2006-2007). This illustrates a key problem with the Macro Index. Since it has no trend following filter, sometimes it will miss out on big stock market rallies.
So let's make an improvement.
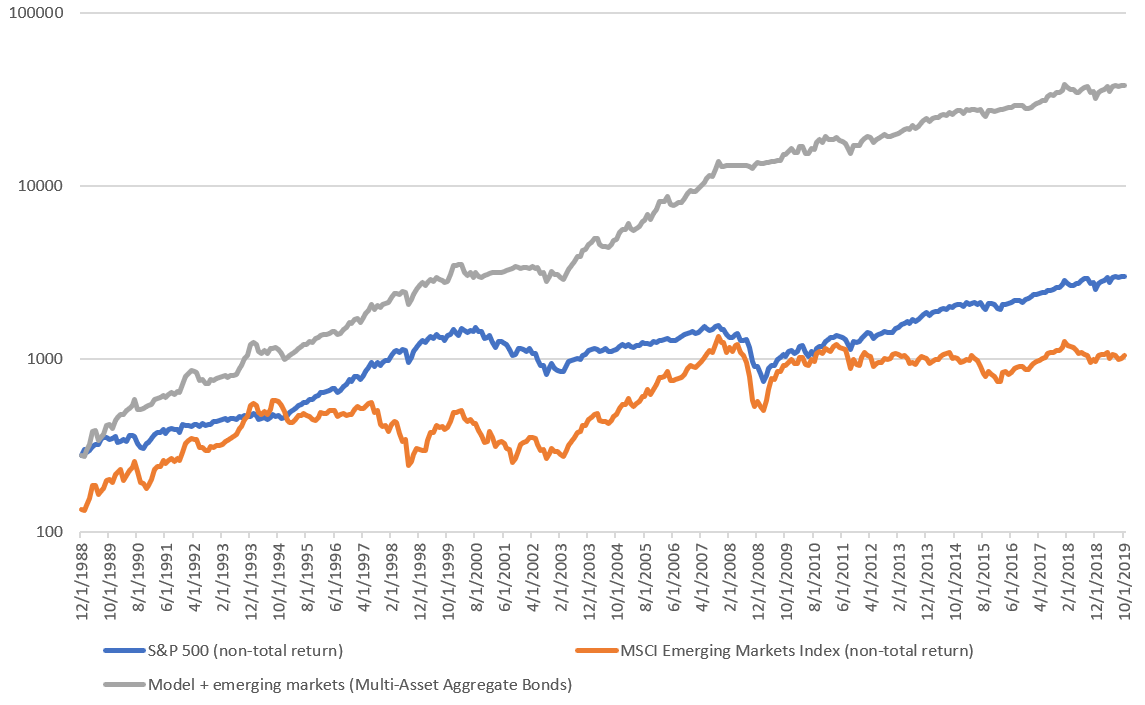
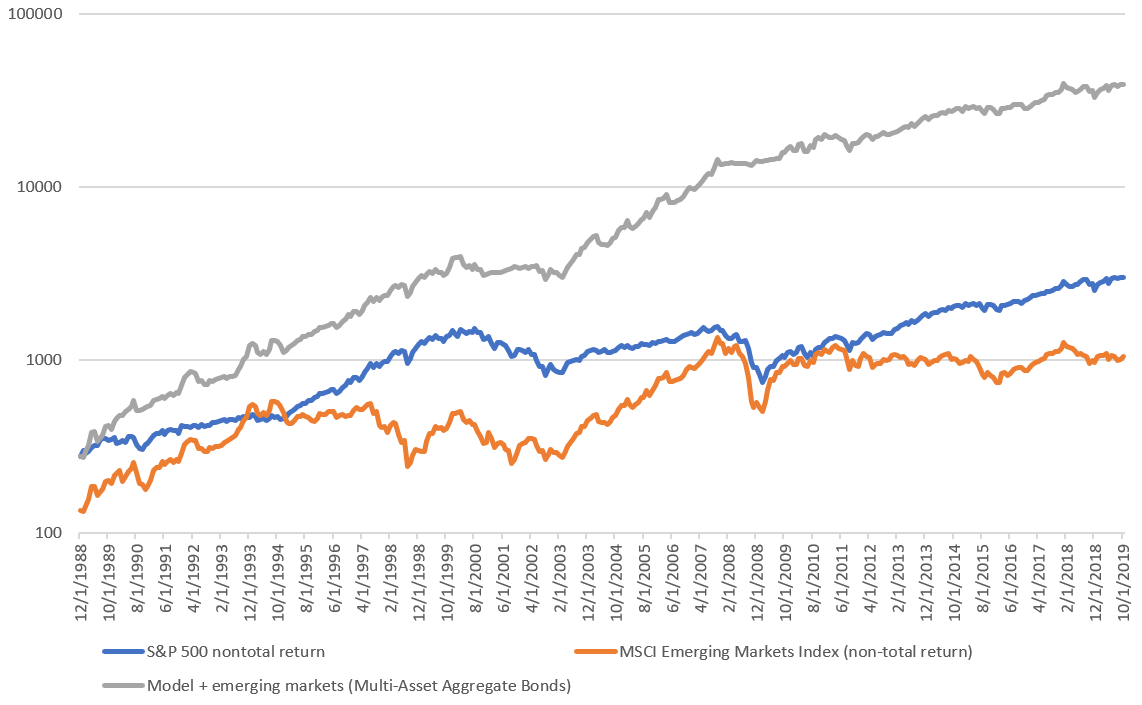
Macro Index Model (version 2) + Emerging Markets
Here are the model's rules:
- If the Macro Index ≤ 0.7 AND the S&P 500 is below its 12 month moving average, SELL and don't buy stocks.
- Otherwise…..
- If the MSCI Emerging Market Index's 12 month rate-of-change has exceeded the S&P 500's 12 month rate-of-change, go 100% long the MSCI Emerging Markets Index.
- Otherwise, go 100% long the S&P 500
*When you don't buy stocks, buy the Bloomberg Barclays U.S. Aggregate Bond Index
Average annual returns
From December 1988 - September 2019:
- The original Macro Index has an average annual return of 11.21% per year
- Macro Index Model + Emerging Markets has an average annual return of 17.53% per year
*These returns don't include dividends reinvested. Including dividends reinvested, average annual returns would be higher.
Sharpe ratio
From December 1988 - September 2019:
- The original Macro Index Model has a Sharpe ratio of 0.56
- Macro Index Model + Emerging Markets has a Sharpe ratio of 0.93
*This Sharpe ratio is artificially low because it does not take into account dividends reinvested. Including dividends reinvested, Sharpe would be higher
Simple Trading Model With Fundamentals + Emerging Markets
Here are the model's rules:
- If the Unemployment Rate is above its 12 month average and the S&P 500 is below its 12 month average, SELL and don't buy stocks.
- Otherwise...
- If the MSCI Emerging Market Index's 12 month rate-of-change has exceeded the S&P 500's 12 month rate-of-change, go 100% long the MSCI Emerging Markets Index.
- Otherwise, go 100% long the S&P 500
*When you don't buy stocks, buy the Bloomberg Barclays U.S. Aggregate Bond Index
Average annual returns
From December 1988 - September 2019:
- The original Simple Trading Model With Fundamentals has an average annual return of 11.49% per year
- Simple Trading Model With Fundamentals + Emerging Markets has an average annual return of 18.1% per year
*These returns don't include dividends reinvested. Including dividends reinvested, average annual returns would be higher.
Sharpe ratio
From December 1988 - September 2019:
- The original Simple Trading Model With Fundamentals has a Sharpe ratio of 0.57
- Simple Trading Model With Fundamentals + Emerging Markets has a Sharpe ratio of 0.97
*This Sharpe ratio is artificially low because it does not take into account dividends reinvested. Including dividends reinvested, Sharpe would be higher.
We can improve returns even more if we include 2 sentiment/breadth indicators, as outlined here.
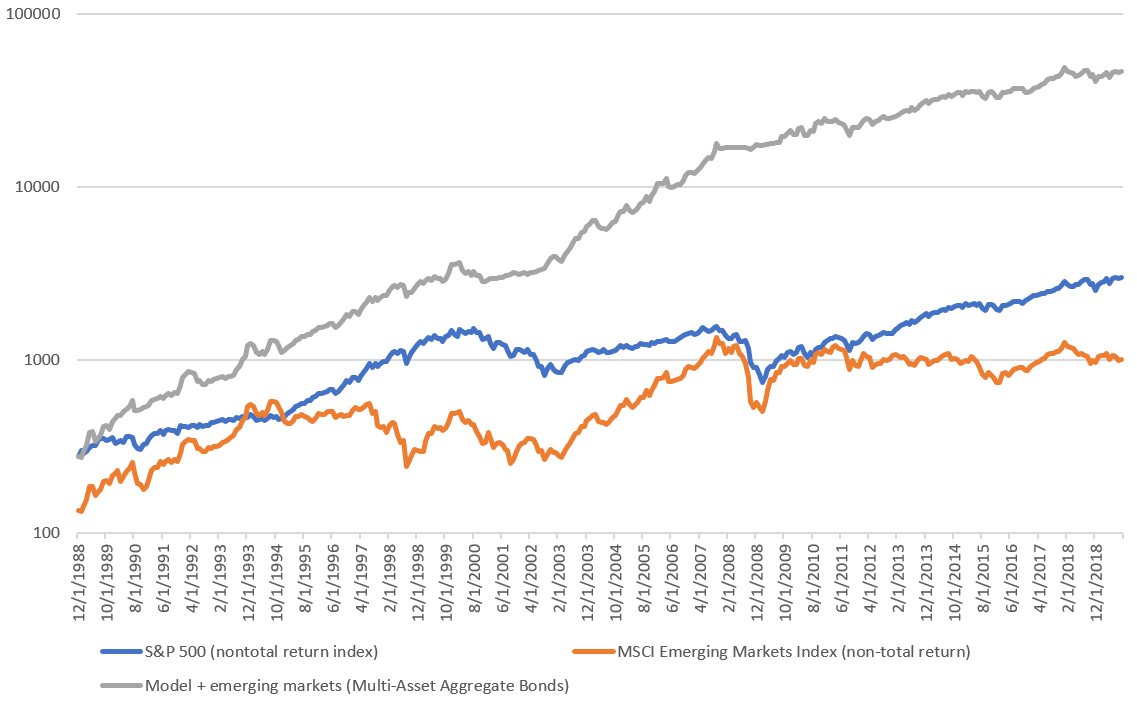
Simple Trading Model With Fundamentals + Emerging Markets + Sentiment Indicators
Here are the model's rules:
- If the Unemployment Rate is above its 12 month average and the S&P 500 is below its 12 month average, SELL and don't buy stocks.
- Otherwise...
- If the MSCI Emerging Market Index's 12 month rate-of-change has exceeded the S&P 500's 12 month rate-of-change, go 100% long the MSCI Emerging Markets Index.
- Otherwise, neither "Stock/Bond ratio was >2.5 sometime over the past 2 months" nor "NYSE HiLo Logic Index's 10 dma was >3 sometime over the past 2 months", go 100% long the S&P 500
- Otherwise, SELL and don't buy stocks.
*When you don't buy stocks, buy the Bloomberg Barclays U.S. Aggregate Bond Index
Average annual returns
From December 1988 - September 2019:
- Simple Trading Model With Fundamentals + Emerging Markets + Sentiment Indicators has an average annual return of 18.98% per year
*These returns don't include dividends reinvested. Including dividends reinvested, average annual returns would be higher.
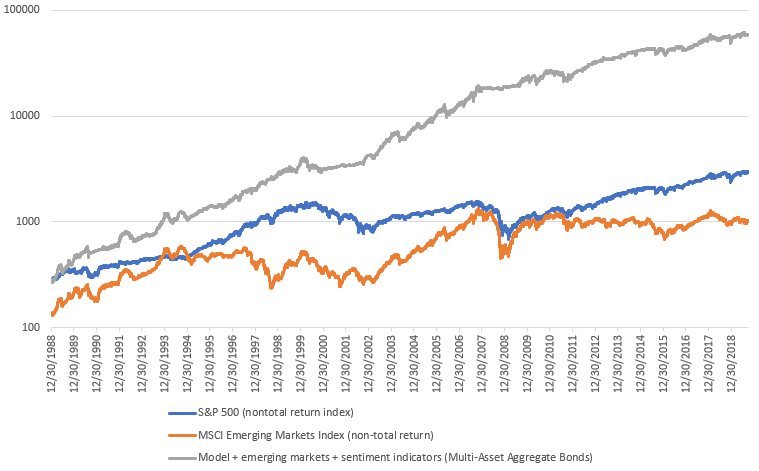
Sharpe ratio
From December 1988 - September 2019:
- Simple Trading Model With Fundamentals + Emerging Markets + Sentiment Indicators has a Sharpe ratio of 1.01
*This Sharpe ratio is artificially low because it does not take into account dividends reinvested. Including dividends reinvested, Sharpe would be higher.
Conference Board LEI Model + Emerging Markets
Here are the model's rules:
- If the Conference Board LEI's 6 month rate-of-change is negative AND the S&P is below its 12 month moving average, SELL and don't buy stocks.
- Otherwise...
- If the MSCI Emerging Market Index's 12 month rate-of-change has exceeded the S&P 500's 12 month rate-of-change, go 100% long the MSCI Emerging Markets Index.
- Otherwise, go 100% long the S&P 500
*When you don't buy stocks, buy the Bloomberg Barclays U.S. Aggregate Bond Index
Average annual returns
From December 1988 - September 2019:
- The original Conference Board LEI Model has an average annual return of 10.87% per year
- Simple Trading Model With Fundamentals + Emerging Markets has an average annual return of 17.35% per year
*These returns don't include dividends reinvested. Including dividends reinvested, average annual returns would be higher.
Sharpe ratio
From December 1988 - September 2019:
- The original Conference Board LEI Model has a Sharpe ratio of 0.52
- Conference Board LEI Model has a Sharpe ratio of 0.92
*This Sharpe ratio is artificially low because it does not take into account dividends reinvested. Including dividends reinvested, Sharpe would be higher