
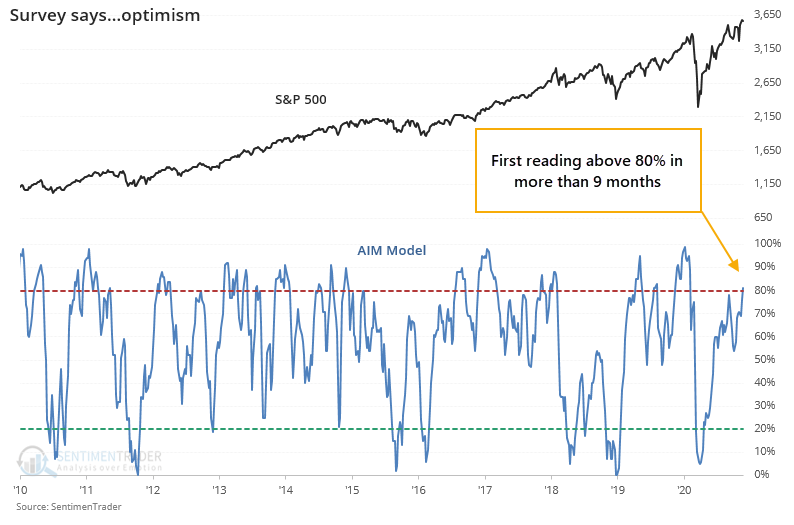
AIM Model

For the first time in 9 months, surveys of investor attitudes are broadly showing evidence of optimism.
We've already seen that in mom-and-pop surveys like the one from AAII. While it's a favorite of knee-jerk contrarians, in practice it hasn't worked out so well that way.
That was one of the few holdout surveys to show persistent pessimism in the face of rising prices. Now, most surveys are showing more or less the same thing, pushing our AIM Model above 80%.
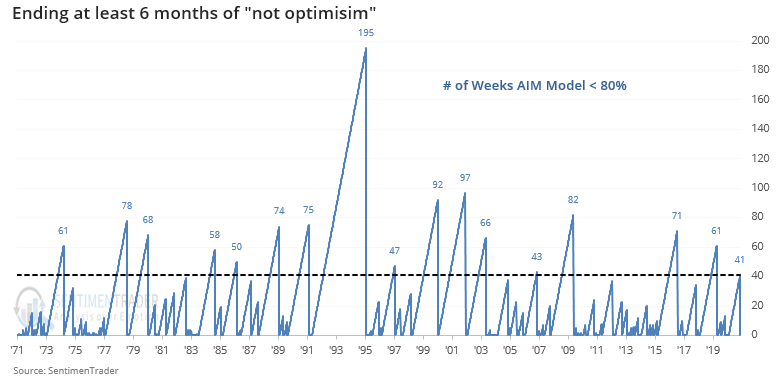
This ends a streak of 41 weeks, more than 9 months, with the model showing "not optimism," which is among the longest streaks since 1970.
At the same time the survey is ending a long streak without showing extreme optimism, stocks have performed very well. The table below shows every time in the past 50 years when the model finally record optimism for the first time in more than 6 months and the S&P was at least within 5% of a multi-year high at the time.
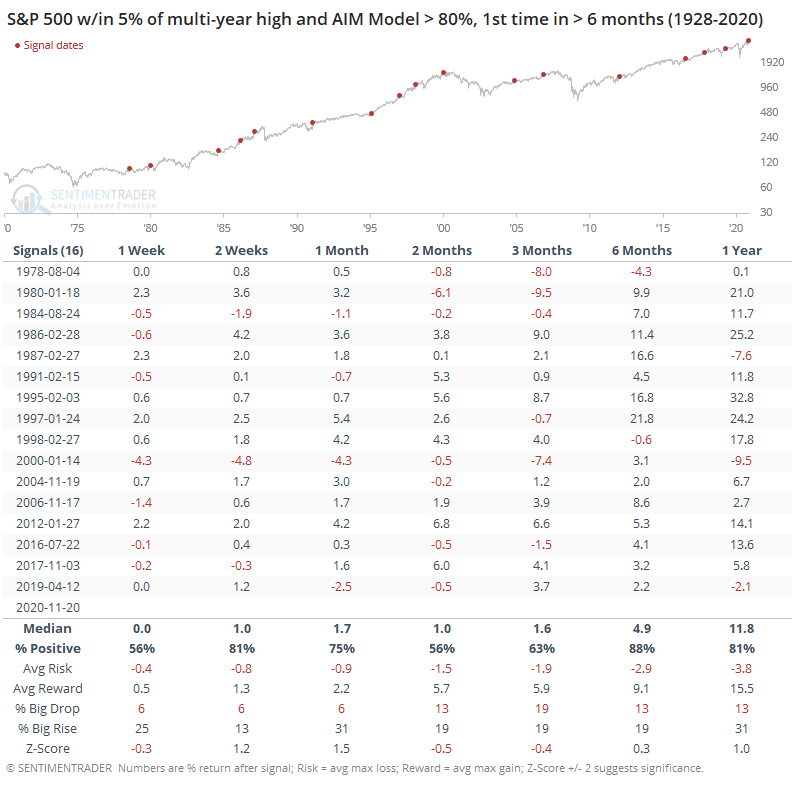
This was not a good reason to immediately turn defensive. Over the next couple of weeks, the S&P added to its gains 81% of the time. Even over the next month, the risk/reward was favorable, and with a much better probability of showing a big rise versus a big fall (see this Knowledge Base article for more detail about how to read the tables).
The biggest negative was over the next 2-3 months, when some of the initial gains got erased. We see this quite often with displays of high optimism and momentum - shorter-term returns tend to skew to the positive side as more buyers are sucked in, but then they hit a more medium-term soft spot due to simple exhaustion. Longer-term returns were consistently positive, as the soft spot allowed buying interest to build up again.