
All Country Percent Above 50-Day Reversal Signal

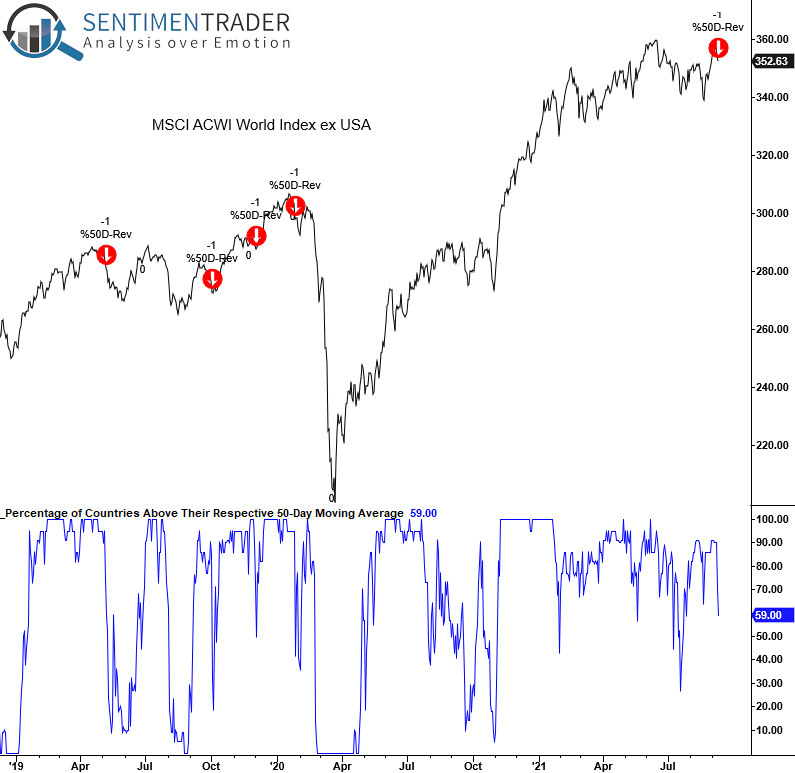
The percentage of countries trading above their respective 50-day moving average registered a sharp reversal lower over the previous two trading days. According to our calculations, the time series reversed from 90% to 59%.
Let's conduct a study to assess the forward return outlook for the MSCI ACWI World Index ex USA when the percentage of countries trading above their respective 50-day average goes from >= 90% to <=60% in two days or less.
CURRENT DAY CHART
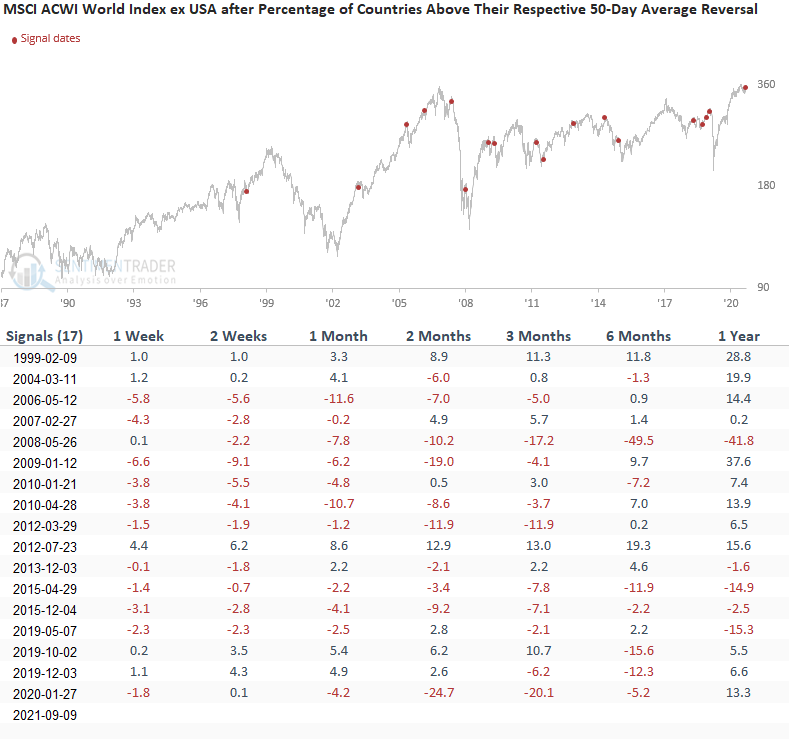
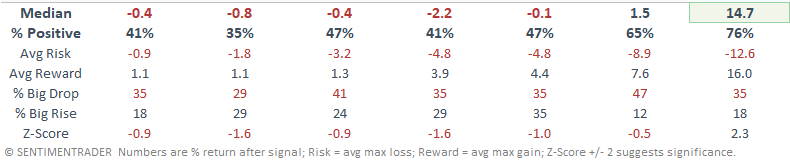
HOW THE SIGNALS PERFORMED
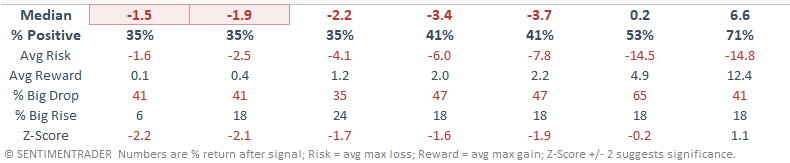
Results look weak on a short to intermediate-term basis, especially the 1-2 week timeframe.
The percentage of countries trading above their respective 50-day average time series starts in 1971. However, the MSCI ACWI data starts in 1988.
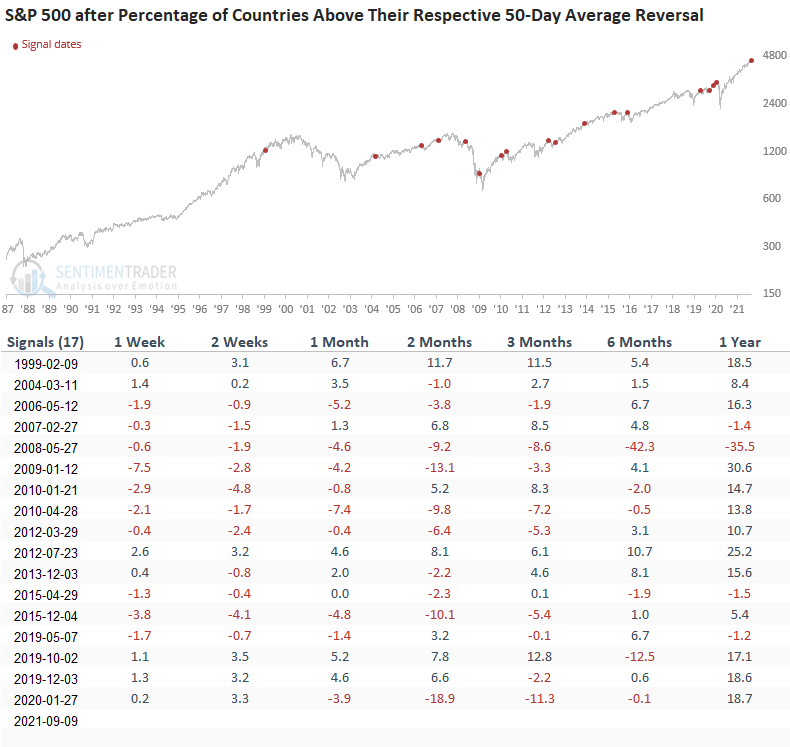
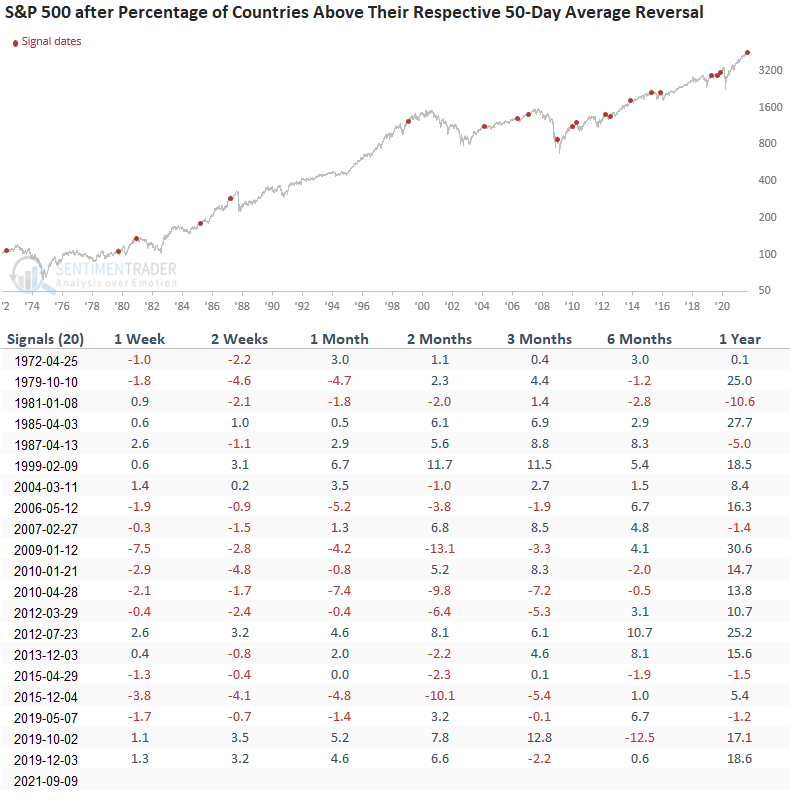
Let's apply the same signals to the S&P 500 Index.
HOW THE SIGNALS PERFORMED - S&P 500
Results look weak on a short to intermediate-term basis. Interestingly, the 1-year performance is good, which would suggest the signal is more than likely to identify a correction within an ongoing bull market.
You may notice that one of the signal dates does not match the MSCI table. That's due to the memorial day holiday in 2008.
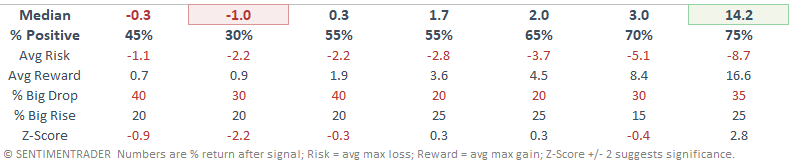
If we apply the series to the S&P 500 since 1971, we get an additional five signals.
HOW THE SIGNALS PERFORMED - S&P 500
The additional signals continue to suggest an unfavorable short to intermediate-term outlook.
As we've seen with several other short-term breadth studies this year, a cautious outlook hasn't worked when central bank liquidity is plentiful.