Among the smallest of traders, this is different than August

One of our primary points of focus since August has been the behavior of options traders. They broke all records dating back 20 years in terms of sheer speculative fervor.
They let up a bit during the September swoon and recent market recoveries have emboldened them again, but not quite to the same degree. They got slapped with some losses and that seems to be tempering their willingness to try again.
Even so, the smallest of options traders spent more of their volume on buying call options to open last week, once again among the highest levels since 2000. One modest difference is that they didn't completely abandon the protective allure of put options. They still spent more than 20% of their volume there, quite a bit above recent extremes.
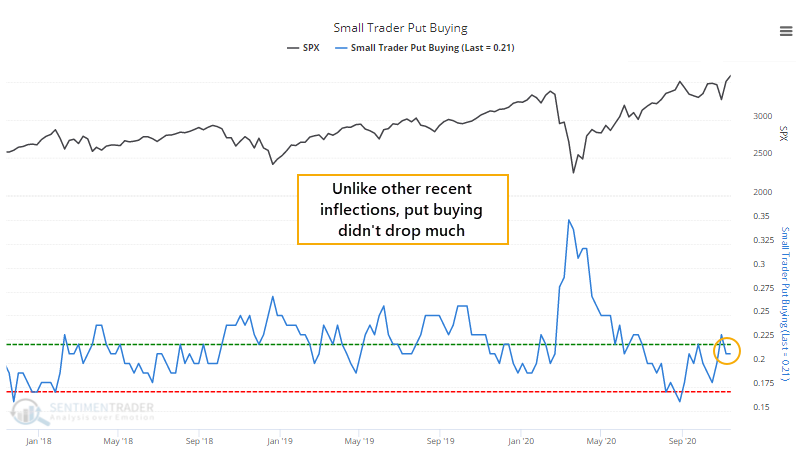
As a result, our ROBO Put/Call Ratio, which stands for Retail-Only-Buy-to-Open, dropped below its extreme threshold again. It's still above the extremes from recent months, but we can see from the chart that the S&P 500's annualized return when the Ratio is below its lower threshold is miserly.
What else is happening
These are topics we explored in our most recent research. For immediate access with no obligation, sign up for a 30-day free trial now.
- More detail on small trader option activity last week
- What happens after the small-cap Russell 2000 breaks out to a new high
- Breadth within the S&P 500 is pristine on a short-, medium-, and long-term time frame
- The volatility of the VIX, or VVIX, is 5 times higher than the VIX itself - what that's meant for stocks and the VIX going forward
- What happens when insiders appear to suddenly start selling stocks
- This many stocks in the Russell 2000 in uptrends has been seen only 5 other times
- Similar with financials
- The Nikkei 225 is getting very overbought
Coding for investors
Do you want to know how we test some of our strategies? Using free, readily available tools, you can. Don't be hemmed in by common misperceptions and outright disinformation about what works and what doesn't - test it yourself.
If you're new to coding, this initial video in a new series is a must-watch. We walk you step-by-step in creating a simple algorithmic trading strategy using the popular Relative Strength Index (RSI).
| Stat Box Participation in the recent rally has been exceptional on all time frames. By late last week, more than 85% of stocks within the S&P 500 were trading above their short-, medium-, and long-term moving averages. Over the past 30 years, this has been matched 12 times, and a year later the S&P added to its gains all 12 times. |
Sentiment from other perspectives
We don't necessarily agree with everything posted here - some of our work might directly contradict it - but it's often worth knowing what others are watching.
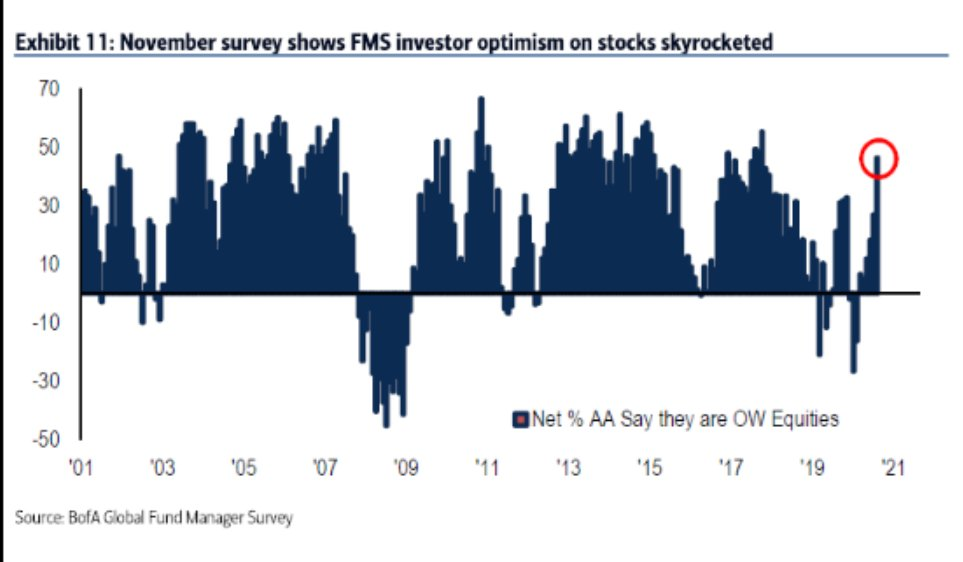
1. Fund managers as polled by BofA are increasingly optimistic. Be aware that this survey doesn't have the greatest record as a contrary indicator, however. [Bank of America]
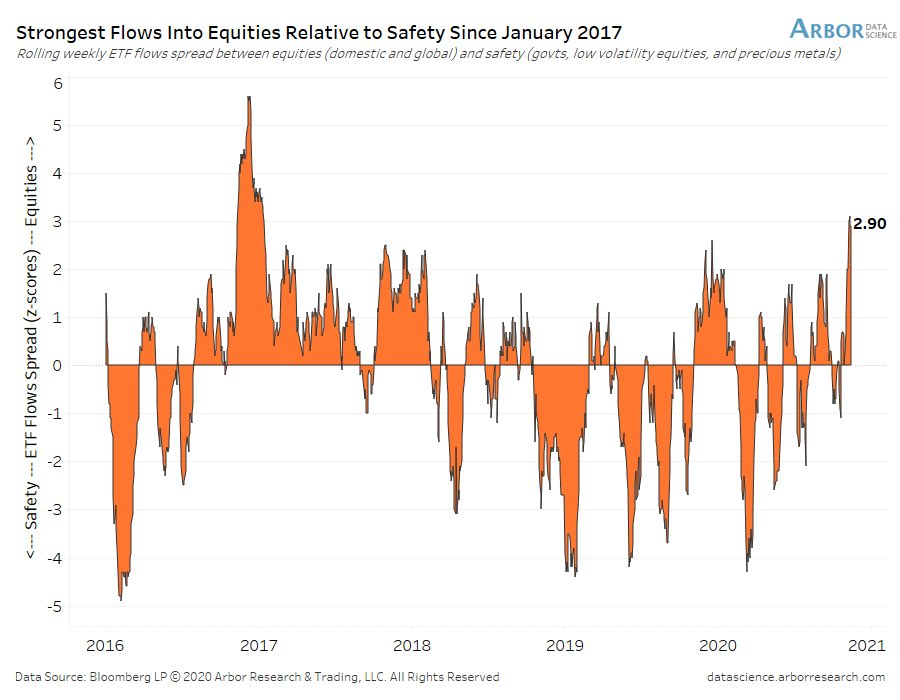
2. Other investors, too, are favoring "not safe" equities. The spread between domestic and global ETF equity flow and that for safer assets is now the widest since 2017. [Arbor Data Science]
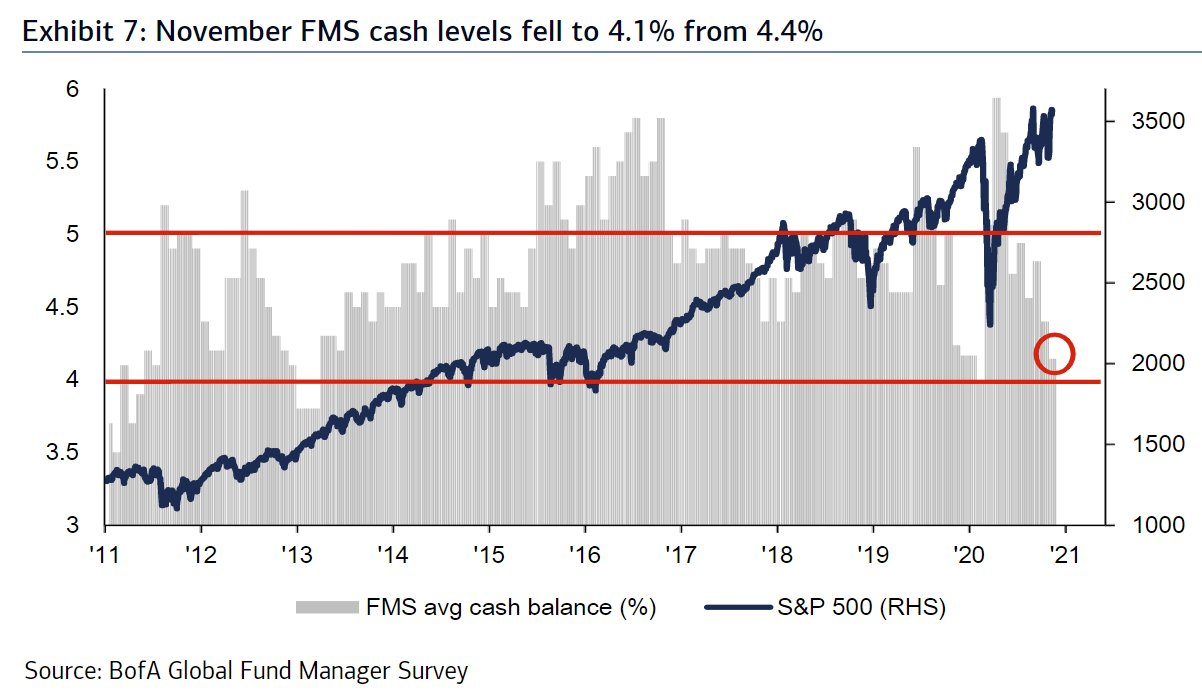
3. Back to those fund managers - by buying stocks, they pulled money from cash at one of the fastest rates in a decade. That was a really bad sign for stocks earlier in 2020, but in 2013, using this as a contrary indicator would have had one miss out on massive gains. [Bank of America]