Products
SentimenTrader Trading Tools
‍
Backtest Engine
My Trading Toolkit
Correlation Analysis
Seasonality
Indicators & Data API
‍
Proprietary Indicators & Charts
Market Data API
Strategies & Scanner
‍
50+ Trading Strategies
Smart Stock Scanner
Research Reports
‍
Research Solutions
Reports Library
Free Resources
Simple Backtest Calculator
Simple Seasonality Calculator
The Kelly Criterion Calculator
Sentiment Geo Map
Public Research Reports
Pricing
Company
About
In the News
Testimonials
Client Success Stories
Contact
Log inLoginSign up
< BACK TO ALL REPORTS

An unequal rally

Jason Goepfert
2020-04-16
Over the past month, stocks and indexes have rallied strongly. The version of the S&P 500 that weights stocks equally, though, has underperformed the version that weights them based on market capitalization. The ratio between them just hit a new low.

The rally off the March lows has been impressive, historic even. There's quite a bit to like about it, namely the retracement of the decline and multiple breadth thrusts.

There's a lot not to like, too, which we don't usually see when enjoying a powerful move like this. Outside of the stock market, signs of a thaw have been hit-or-miss, and there's been a lot of odd activity. That can happen when relatively few stocks are driving the market.

That seems like an odd thing to say since there have been multiple days with 90% of more of securities advancing. But the biggest stocks have had a major impact on indexes like the S&P 500.

Multiple people have pointed out that even while the S&P 500 index that everyone watches hit its highest level in a month, the equal-weight version of the index hasn't quite kept up. The ratio between the two just hit a new low.

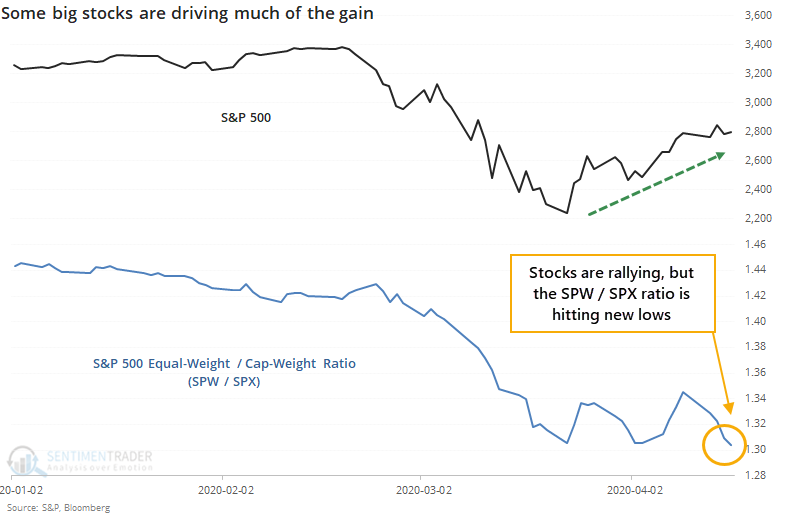
We looked at this in January. While there were some major reasons to be worried about stocks, this ratio was not one of them. About the only consistent thing it suggested was that the equal-weight version of the index should keep under-performing.

Below, we can see the times most similar to now, when the S&P 500 cap-weighted index was trading below its 200-day average but hit a 20-day high in the past three sessions, and the ratio between the equal-weight (SPW) and cap-weight (SPX) indexes hit a 20-day low.

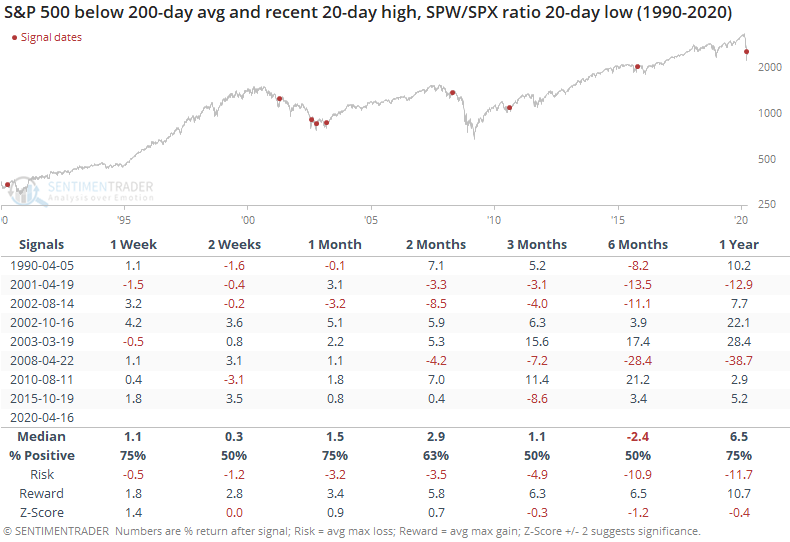
Not much to go on there, with mixed returns across time frames. Maybe a bit weak longer-term.

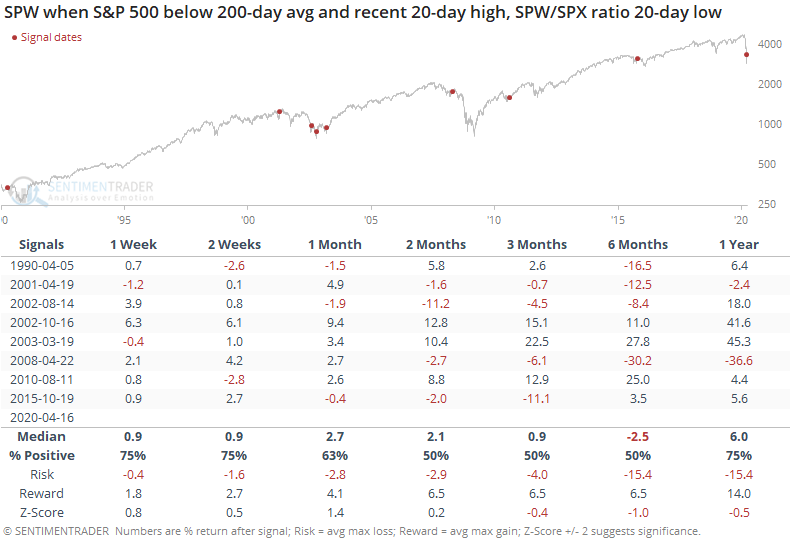
For the equal-weight index, it was about the same story.

For the ratio, though, it was more positive. It was positive across most time frames, meaning the equal-weight index performed better than the capitalization-weight index.

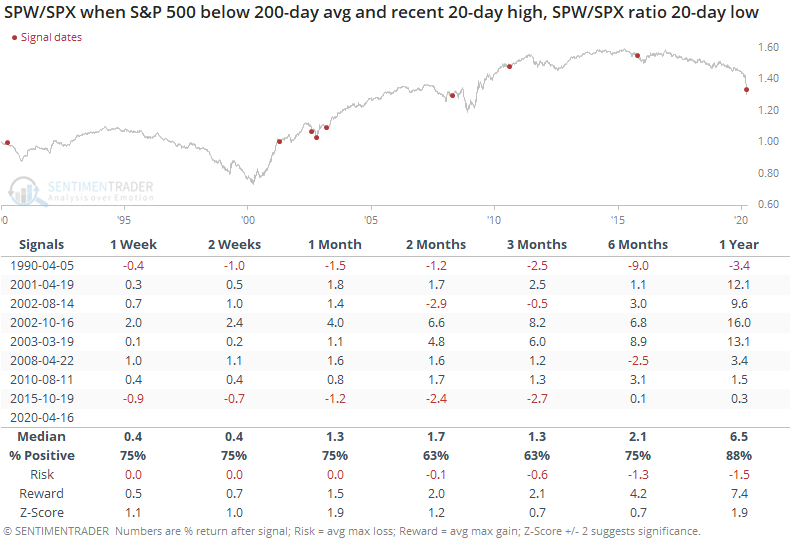
Investors have been looking for this series to mean-revert for a long time. The equal-weight index has under-performed for about 5 years, nearing the previous record from the late 1990s.

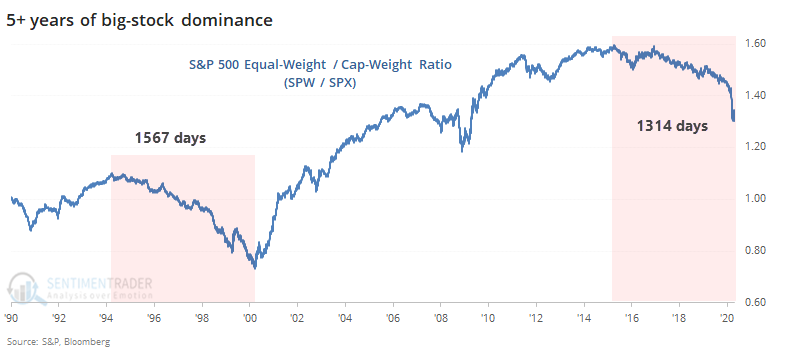
There isn't much of a catalyst for it to start now, though some of the "trillion-dollar stock club" fetishes from the start of this year are a compelling anecdotal sign. Usually, when we look at ratios like this, they tend to favor an extension of the trend, but that wasn't the case this time. Maybe that 5-year trend is finally nearing some exhaustion.

Sorry, you don't have access to this report

Upgrade your subscription plan to get access
Go to Dasboard
PRODUCTS
SentimenTrader
Trading Tools
Indicators & Data API
‍
Strategies & Scanner
‍
Research Reports
FREE
RESOUrCES
Simple Backtest
Calculator
Simple Seasonality
Calculator
The Kelly Criterion
Calculator
Sentiment Geo Map
‍
Public Research Reports
‍
Pricing
Bundle pricing
‍
Announcements
‍
FAQ
COMPANY
‍
About
‍
In the News
‍
Testimonials
‍
Client Success Stories
CONTACT
‍
General Inquiries
‍
Media Inquiries
‍
Financial Professionals Inquiries
‍
© 2025 Sundial Capital Research Inc. All rights reserved.
Setsail Marketing
TermsPrivacyAffiliate Program
Risk Disclosure: Futures and forex trading contains substantial risk and is not for every investor. An investor could potentially lose all or more than the initial investment. Risk capital is money that can be lost without jeopardizing ones’ financial security or life style. Only risk capital should be used for trading and only those with sufficient risk capital should consider trading. Past performance is not necessarily indicative of future results.

Hypothetical Performance Disclosure: Hypothetical performance results have many inherent limitations, some of which are described below. No representation is being made that any account will or is likely to achieve profits or losses similar to those shown; in fact, there are frequently sharp differences between hypothetical performance results and the actual results subsequently achieved by any particular trading program. One of the limitations of hypothetical performance results is that they are generally prepared with the benefit of hindsight. In addition, hypothetical trading does not involve financial risk, and no hypothetical trading record can completely account for the impact of financial risk of actual trading. for example, the ability to withstand losses or to adhere to a particular trading program in spite of trading losses are material points which can also adversely affect actual trading results. There are numerous other factors related to the markets in general or to the implementation of any specific trading program which cannot be fully accounted for in the preparation of hypothetical performance results and all which can adversely affect trading results.

Testimonial Disclosure: Testimonials appearing on this website may not be representative of other clients or customers and is not a guarantee of future performance or success.