
Another Longer-Term Warning Sign

Every investor has heard dire warnings about "extreme valuations" and "high inflation" (including from me) - typically in the form of high price-to-earnings ratios (or P/E's for short) and large increases in the Consumer Price Index. But the reality is that stocks can stay "overvalued" - and continue to get even more overvalued - for an extended period of time. As a result, it is essential to understand what high P/E's tell you AND DO NOT tell you.
P/E ratios cannot be used to pick tops and bottoms in the stock market because sometimes bull markets end with P/E's in the '20s and other times much higher. But the bottom line is this - P/E ratios:
- DO NOT tell you when a bull market is going to end
- DO tell you how bad the next bear market is likely to be
The best explanation I've heard goes like this (and unfortunately, I cannot recall who came up with it or where I first heard, so my thanks and apologies to the source):
- Recession is the economic equivalent of jumping out the window
- The P/E ratio tells you what floor you are on when you jump
Crude but accurate.
Regarding inflation, the stock market tends to perform best when inflation is moderate, and the economy is in a steady period of growth, i.e., when things are normal. Inflation - whether extraordinarily high or low (i.e., deflation) - creates an abnormal state of affairs for the economy. Sometimes these abnormal circumstances overwhelm the other factors that impact the stock market - and sometimes, they don't.
P/E ratios have been high for several years, and inflation has been high for going on 6 months - and the stock market has not cared one bit. And that is the thing about valuation measures - they do not matter one bit, unless and until they do. And then they typically matter a lot. Which makes this a good time to invoke:
Jay's Trading Maxim #18: Respect the trend, follow the trend, but DO NOT fall in love with the trend.
So what follows is an indicator that does NOT necessarily portend imminent doom for stocks. But it does encourage us to be vigilant as the next bear market - whenever it may come - is likely to be especially painful.
THE DATA
A = Shiller P/E Ratio at end of each month
B = Earnings Yield (A/100)
C = 12-month % change in Consumer Price Index
D = (B - C)
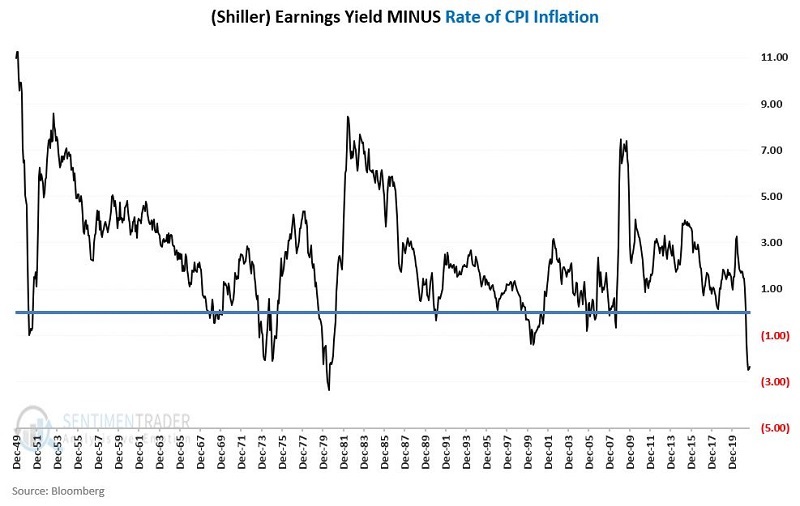
In plain English, we divide the Shiller P/E ratio by 100 to arrive at the "earnings yield." We then subtract the current inflation rate from the earnings yield to arrive at our indicator.
The chart below displays the status of the indicator since 1950.
 THE TEST
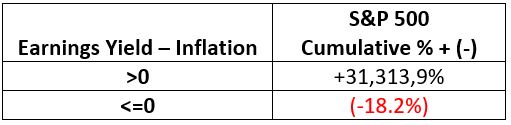
We will examine the returns for the S&P 500 Index depending on whether our indicator is ABOVE 0 or BELOW 0, starting in 1950.
THE RESULTS
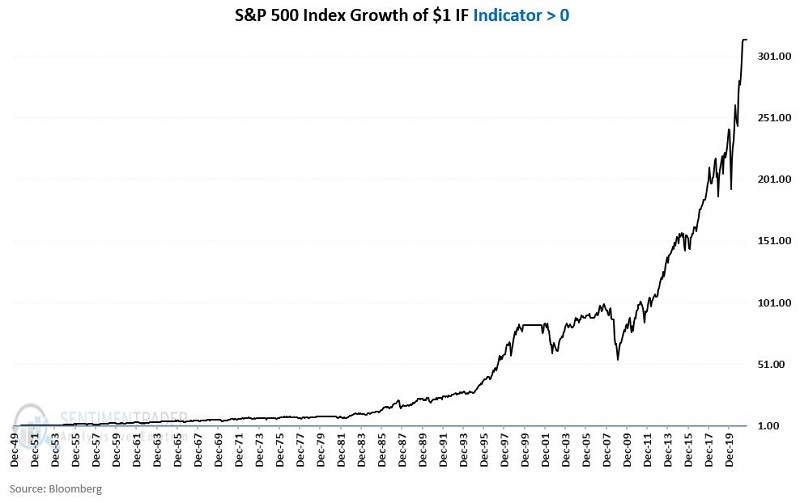
The chart below displays the cumulative % +(-) for the S&P 500 Index (price-performance only) ONLY when the indicator was ABOVE 0 starting in 1950.
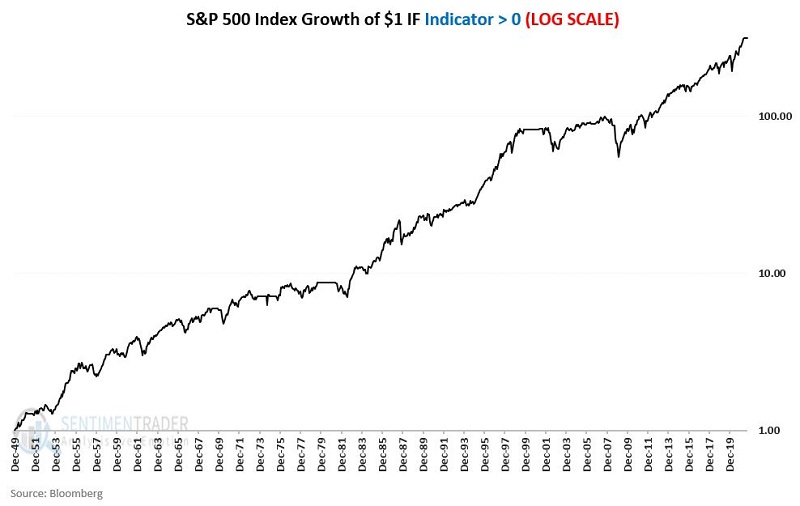
 The chart below displays the cumulative % +(-) for the S&P 500 Index (price-performance only) on a logarithmic scale to better illustrate the consistency of returns.
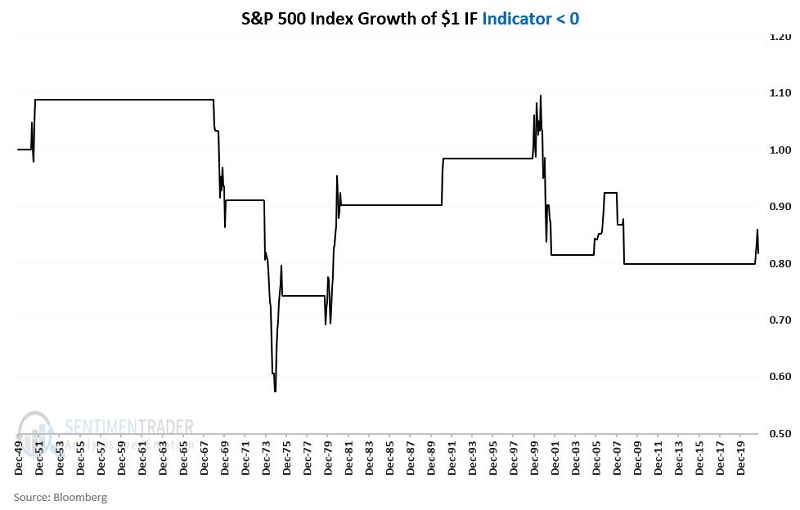
 Now compare the relative consistency of equity growth in the chart(s) above to the following chart. The chart below displays the cumulative % +(-) for the S&P 500 Index (price-performance only) ONLY when the indicator is BELOW 0 starting in 1950.
 The bottom line on results is captured quite succinctly in the table below.
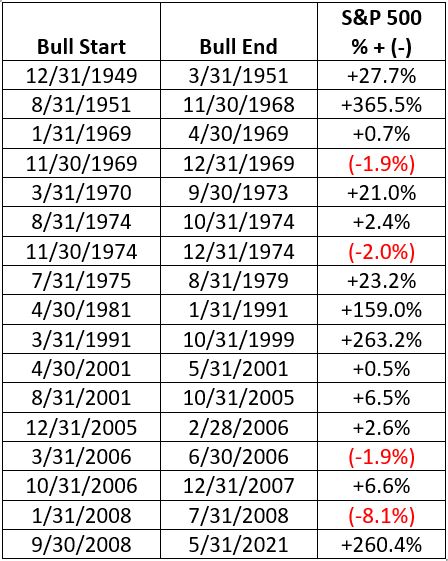
THE BULLISH PERIODS
The table below displays S&P 500 price-performance ONLY during the bullish periods (i.e., earnings yield minus inflation > 0).
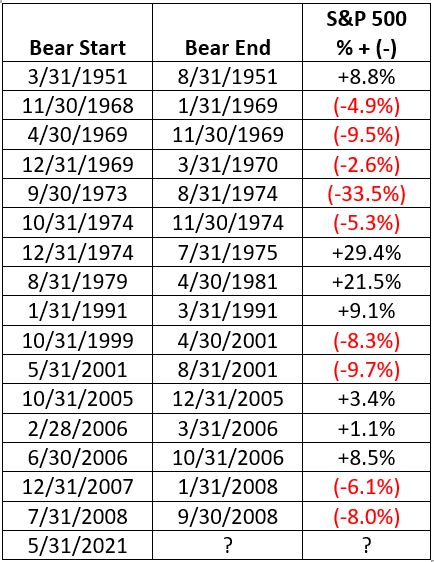
THE BEARISH PERIODS
The table below displays S&P 500 price-performance ONLY during the bearish periods (i.e., earnings yield minus inflation <= 0).
SUMMARY
The table below displays a summary of performance during both bullish and bearish periods.
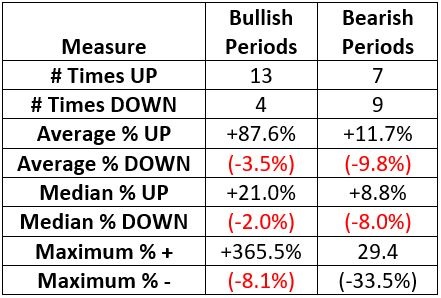
As with most indicators, there are no "sure things" with the Earnings Yield - Inflation indicator detailed here. But clearly, the odds tend to favor the bulls when this indicator is positive and the bears when it is negative.