
A(nother) week for the ages

Like we did last week, conditions have been so volatile that it makes sense to take a breath and do a longer post that can incorporate some of the weekend updates.
It's separated into four basic parts:
1. Volatility
2. Breadth
3. Sentiment
4. Sectors
The overall conclusion is:
Based on these measures and others we've looked at over the past week or so, we're seeing a historic level of volatility, wholesale selling pressure, and panicky behavior. Essentially what it comes down to is that a buyer (or holder) here is betting that this panic is a once-in-a-decade type of thing, and not another once-in-a-generation game-changer like the financial crisis.
None of this suggests that we can't tip into a bear market - in fact, several precedents triggered before past bear markets. It's just that even within the context of a bear market, readings like we're seeing had an extremely high probability of preceding a multi-month rebound.
We’ve gone over quite a few studies and extremes over the past two weeks, most of them touching on some basic factors: 1) A sharp, quick drop, typically from an all-time high, 2) Wholesale selling pressure with historically bad breadth readings, 3) ‘Shocking’ moves relative to recent trends, 4) Stretched prices relative to other assets.
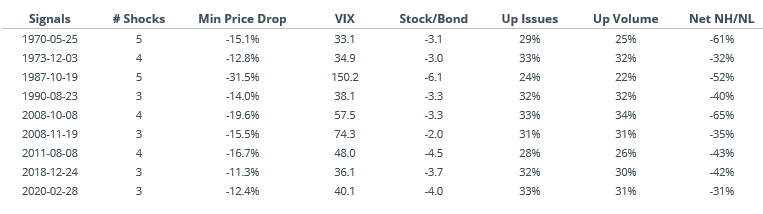
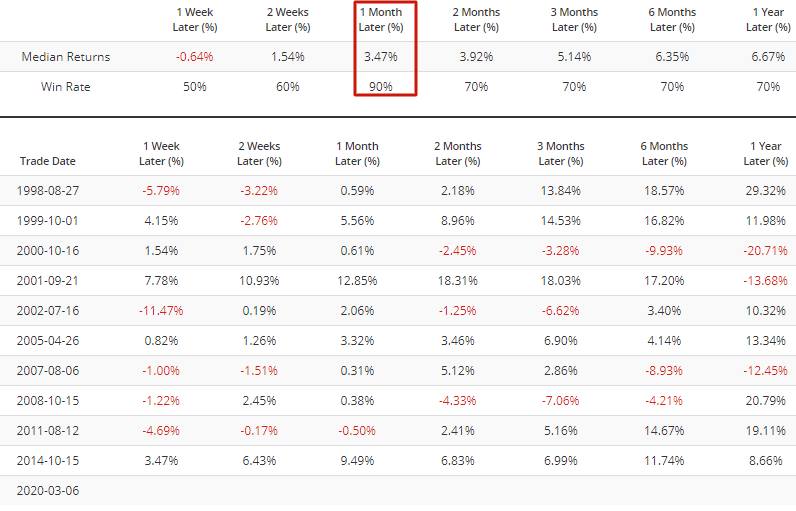
When we go back and look at those basic criteria, we can sum them up in the table below. It looks at times the S&P 500 suffered at least 3 ‘shock’ days in the past two weeks, suffered at least a 10% decline at some point over the past 1, 2, or 4 weeks, saw the VIX spike higher than 30, showed a Stock/Bond Ratio below -2, averaged a 10-day Up Issues and Up Volume Ratio below 35%, and saw a net -30% of NYSE issues at new highs – new lows. The S&P also had to be at a 90-day low or worse at the time.
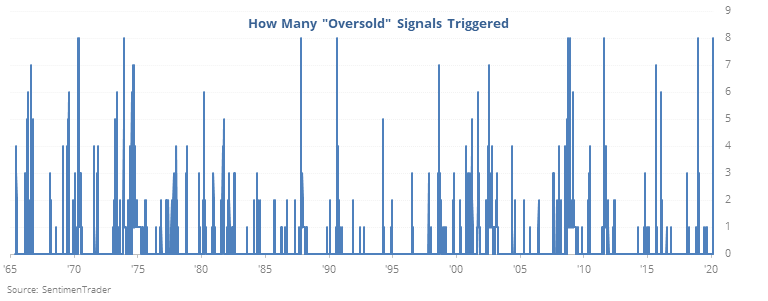
Going back to 1965, there have been a handful of days that met all the criteria. Some of them had slightly lesser extremes than we saw last week, some had bigger. But they all met each of them at the very least.
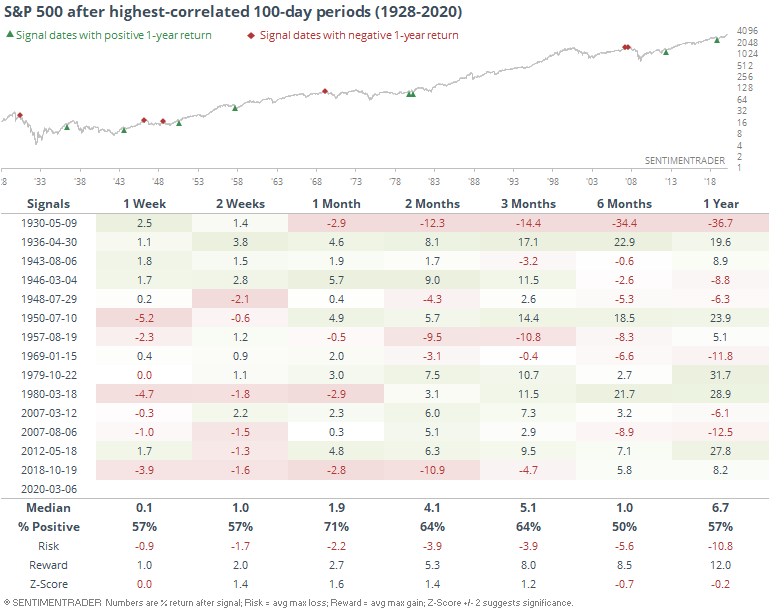
Below, we can see the S&P’s forward returns after each of the dates.
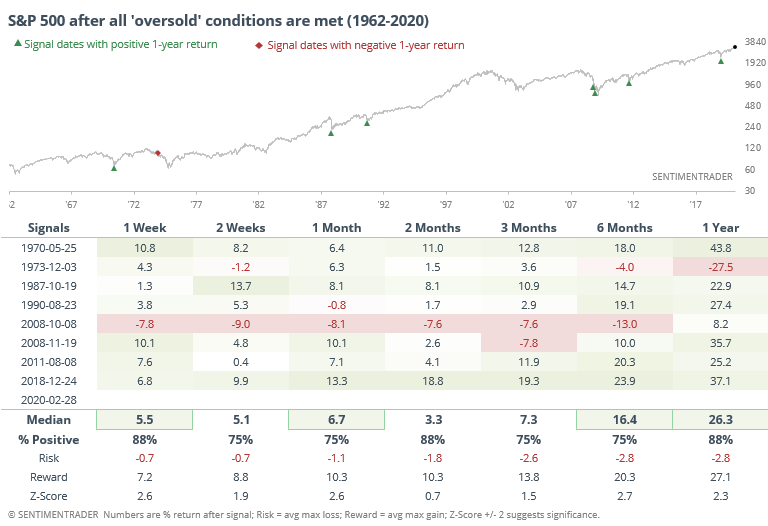
This kind of analysis can be dangerous, and hopefully you take a skeptical eye when you see it. It’s very easy to pick and choose only certain indicators or thresholds when going back over time, and making sure to only choose the ones that looked good.
That’s not the case here – we’re only using ones we’ve recently discussed, and that have history back to at least 1965. Also, if we were trying to find a “perfect” bottom indicator, then we wouldn’t see any failures in the table, but we do.
Still, the overall takeaway is positive, which shouldn’t be a big surprise given the studies we’ve discussed lately. Short-term, extreme volatility after readings like this are not at all uncommon. A persistent decline most certainly would be.
1. Volatility
From high to low
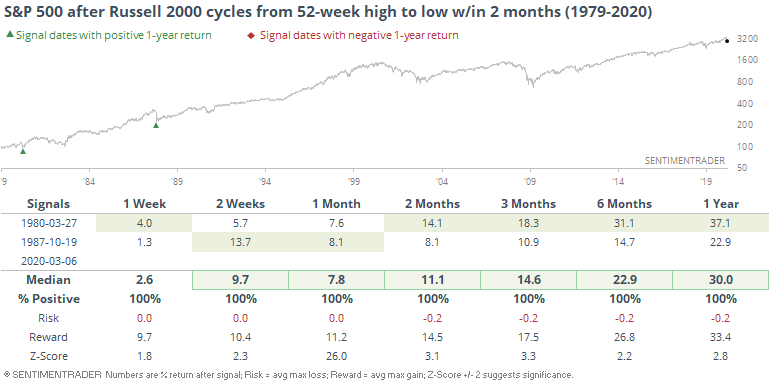
We saw last week how swift and severe the decline was in the S&P 500. It's not the only index, or even the one that suffered the most gut-wrenching turnaround. The small-cap Russell 2000 cycled from a 52-week high to 52-week low within two months. It's only done that twice before.
It had some more time and severe losses before bottoming in 1987, but in 1980 it did so immediately.
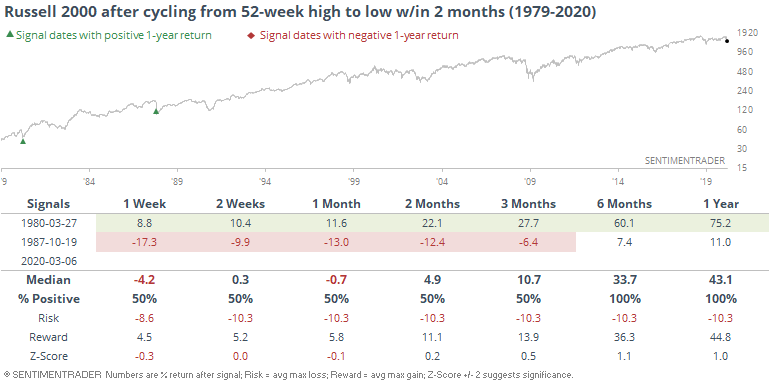
The S&P did amazingly well after both occurrences.
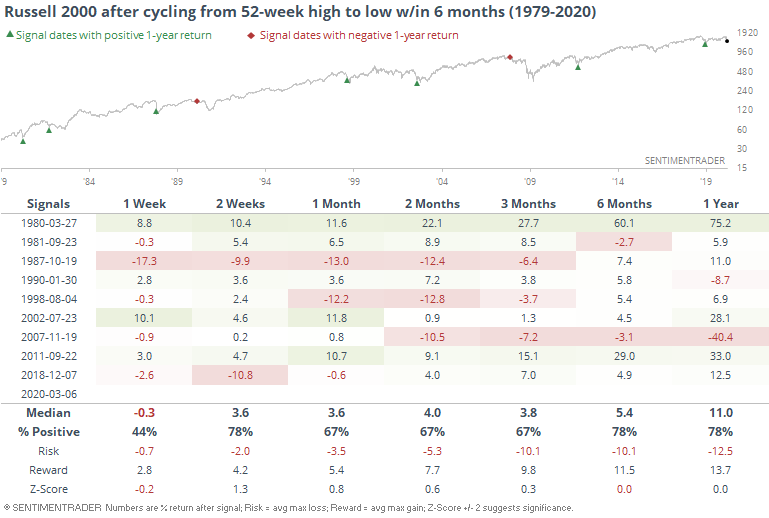
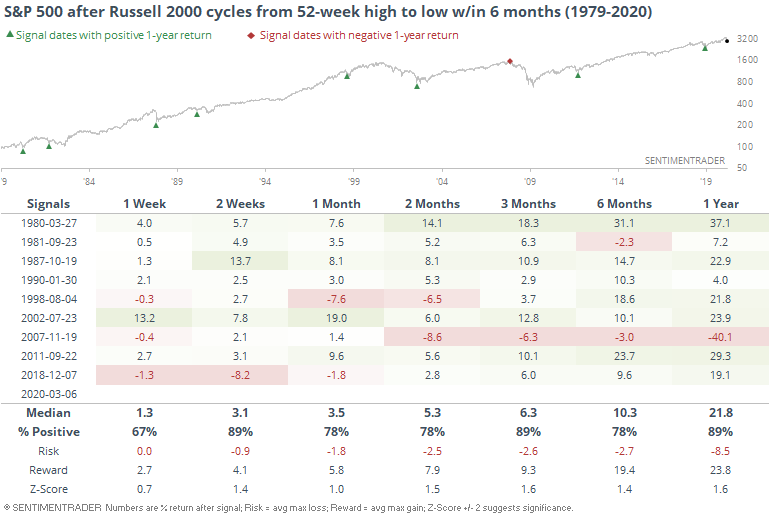
Granted, a sample size of two is hard to rely on, so if we look for times it went from high to low within 6 months instead of 2, then we get a bigger sample, and mixed returns.
Again, it was a better sign for the bigger-cap S&P 500. It was lower only once over the next 3 months.
Analog analysis
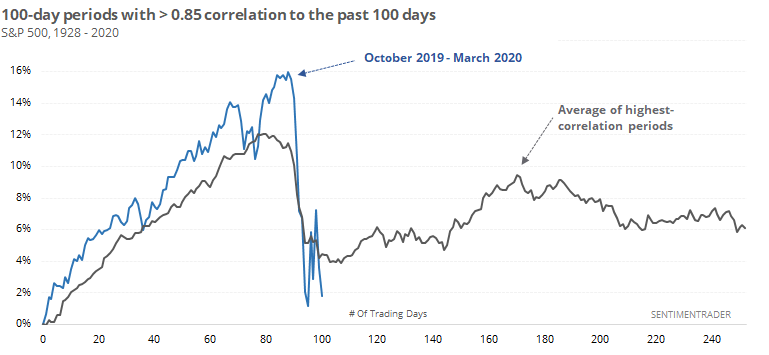
For those who are fans of the "hey, this looks just like..." kinds of chart porn, let's not cherry-pick dates that show an extreme.
Since the S&P 500 took off last October, it's been about 100 sessions. The index has gone through a creeper uptrend and modest crash, which can look like some of the bull market peaks in the past. But when we look at all the dates that had the highest correlation to the past 100 sessions, the overall outcomes were not very drastic.
There were 14 time periods with a 100-day correlation higher than 0.85.
Looking at an arithmetic average can sometimes skew the results, so here's the same data but using the median returns of those 14 signals.
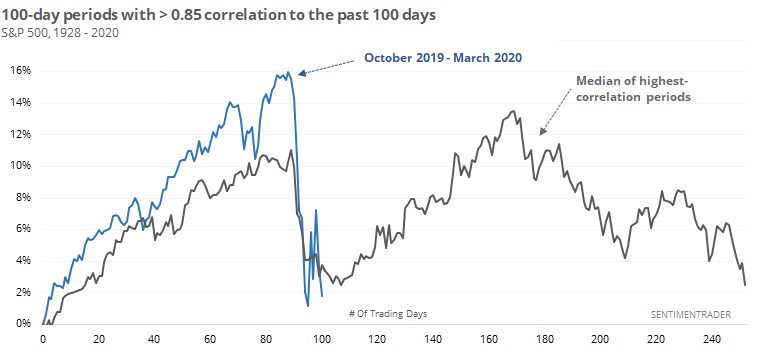
Using the median, there was more of a medium-term rally, and more of a give-back longer-term.
Here are the last 10 instances.
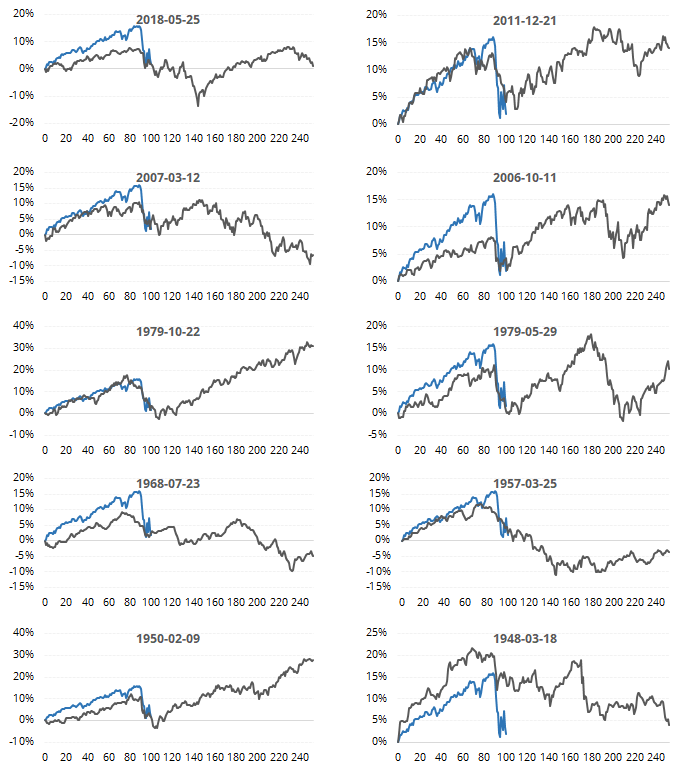
Once we got through those 100-day periods, the S&P's returns going forward were all over the place. A few drastic losses, but mostly gains over the medium-term.
It was not a strong signal, but that's kind of the point...yes, price behavior like this was seen at some important market peaks. But more often, it occurred near the ends of declines, not the beginnings.
Spike in fear
Fear was prevalent enough to end the week that the VXO (the "old VIX" with more history) spiked above 55.
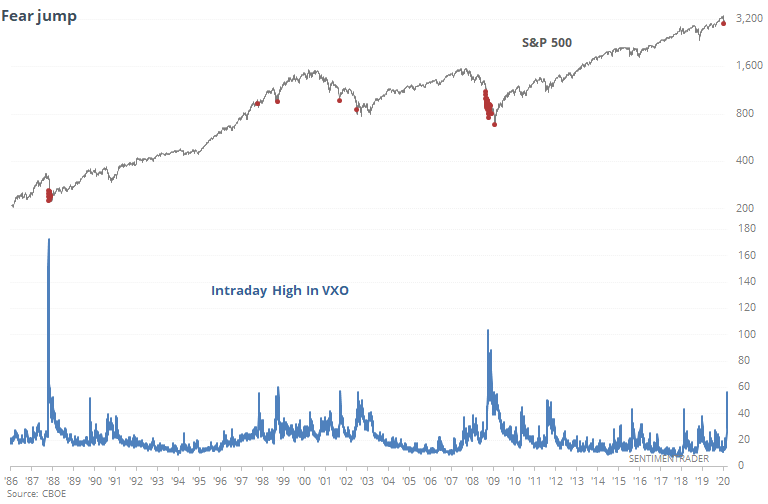
Since 1986, there have been 76 days when its intraday high was above that level, with the S&P 500 showing a higher price a year later after 73 of them, averaging 19.3%.
If we only look at the first time it exceeded 55 in at least a month, then we get the following.
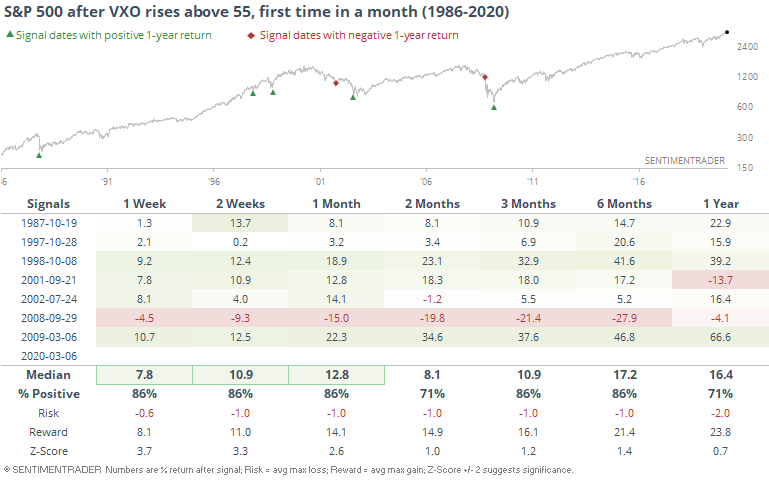
That signal in September 2008 was unpleasant, and it was also the only exception. All the others showed gains for stocks over every time frame up to six months later (okay, there was a 1.2% loss 2 months after the 2002 signal).
It's not just stocks that are volatile. Bonds have been on fire, so much so that the Stock/Bond Ratio has been an average of more than -3 standard deviations for the past 10 days. That has rarely been matched going back 50 years.
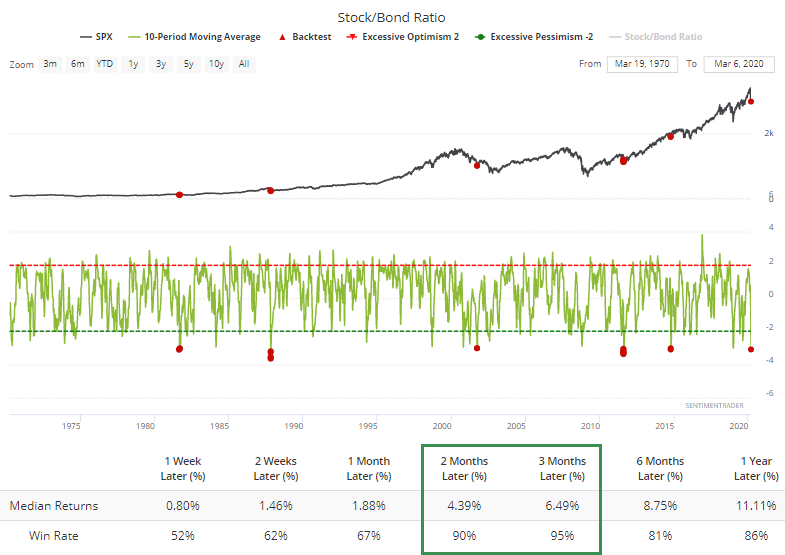
According to the Backtest Engine, out of 21 days that saw it this stretched, only 1 date saw a negative return in the S&P over the next 3 months, and that was -0.07%.
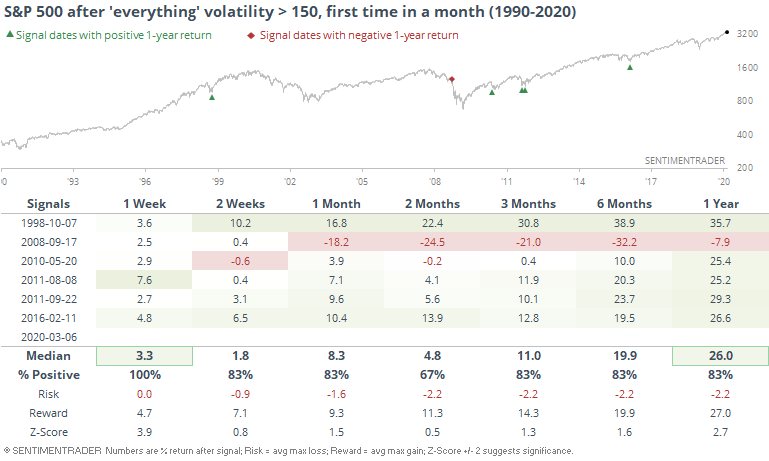
Commodities and currencies have been swinging wildly along with stocks and bonds. If we look at implied volatility across all of the asset classes, normalized to 100, it's clear that the volatility is broad-based.
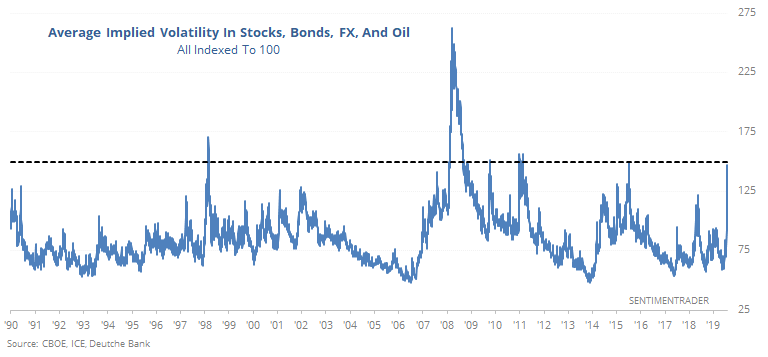
When cross-asset volatility has gotten this high, stocks typically rallied. That 2008 signal, though, was awfully early again.
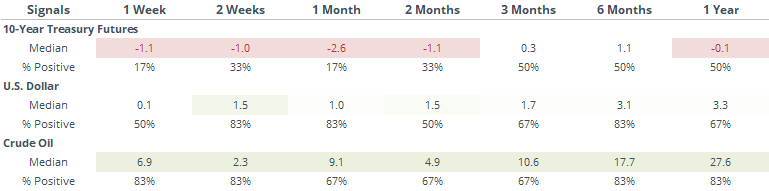
Extremely high cross-asset volatility ended up being a terrible sign for bonds, but good for both the dollar and oil.
[TROY] Financial stress rises
BofA Merill Lynch's Global Financial Stress Indicator spiked over the past 11 days, demonstrating a sudden increase in financial market stress due to extreme volatility in global markets. This isn't a surprise given the many extremes we've been noting in markets recently.
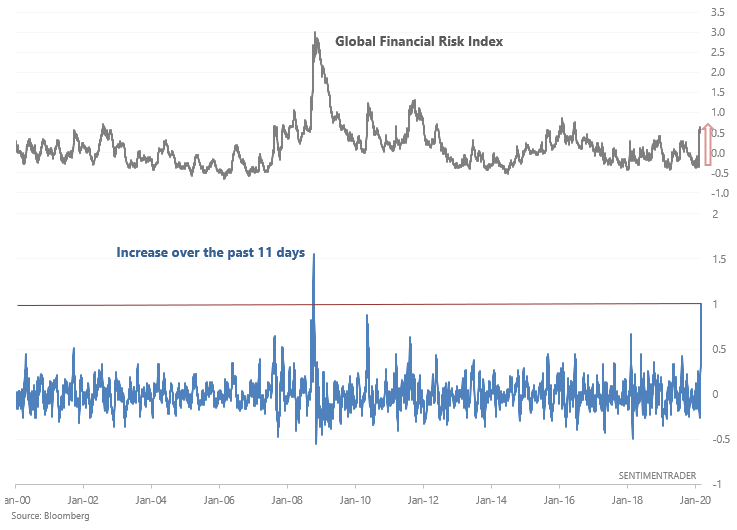
There's only 1 other historical case which saw such an extreme increase in the Global Financial Stress Index: October 2008.
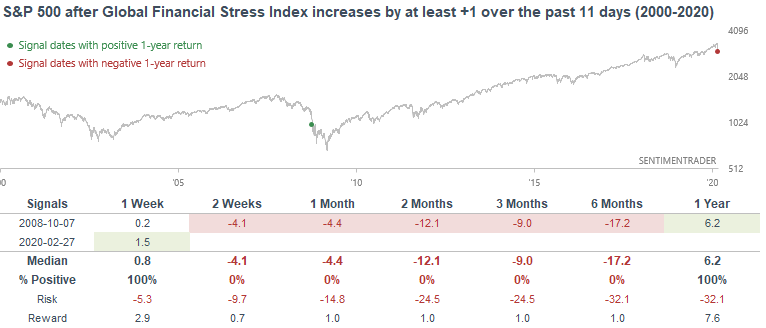
A sample size of 1 isn't very useful, so if we relax the parameters to increase the sample size:
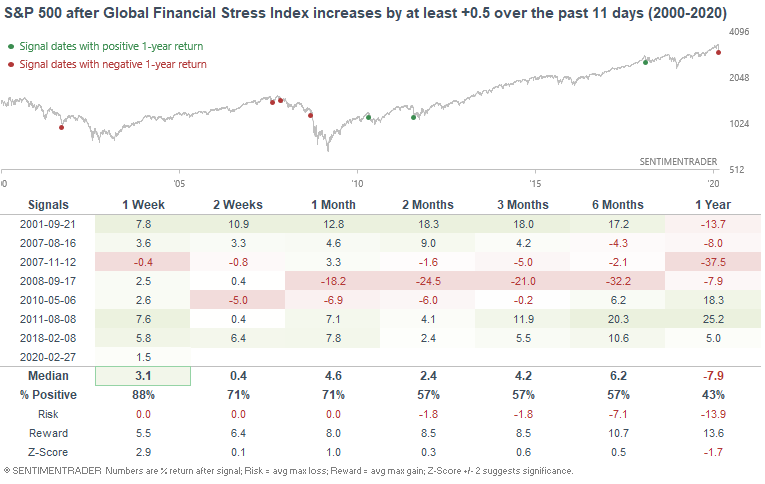
Overall, it's clear that such extreme stress in global markets is bullish during a bull market and not consistently bullish during a bear market. This really comes down to a judgement call - is "today just like 2008"? I don't think so, and even if it is, bear markets don't drop in 1 straight line (particularly at the beginning).
Morning swings
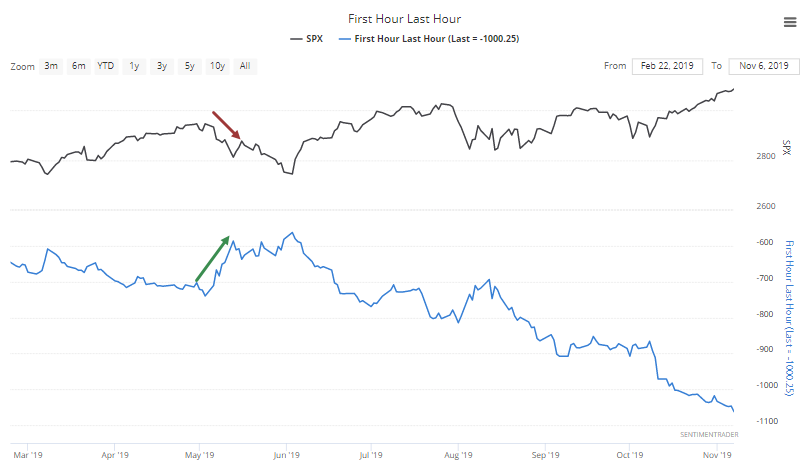
Many of the worst losses in stocks have come overnight or early in the session, while several days saw large rallies into the close. Theories abound about who's doing the buying - passive funds? exposed institutions adjusting risk? shadowy government entities? Regardless, this behavior has made the First Hour Last Hour (FHLH) indicator skyrocket.
Since February 26, the S&P 500 index has lost more than 155 points, but the FHLH has jumped a whopping 418 points. We've never seen anything remotely like this before.
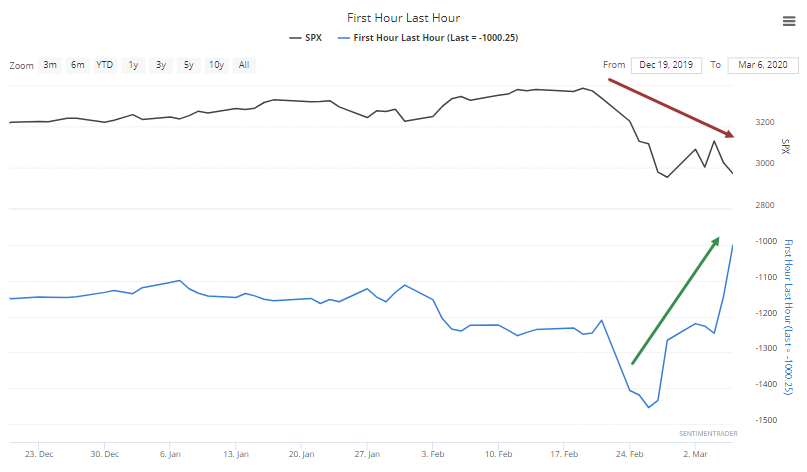
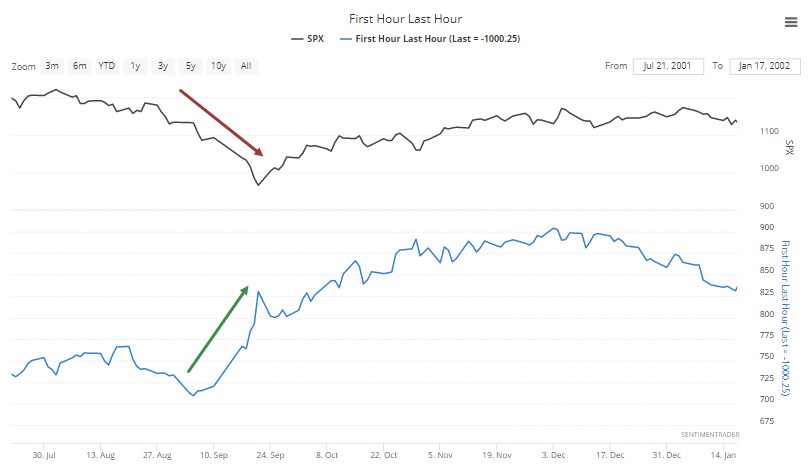
Looking at times the S&P lost more than 100 points while the indicator gained more than 100 over a short stretch like this, there were a few precedents, like September 2001.
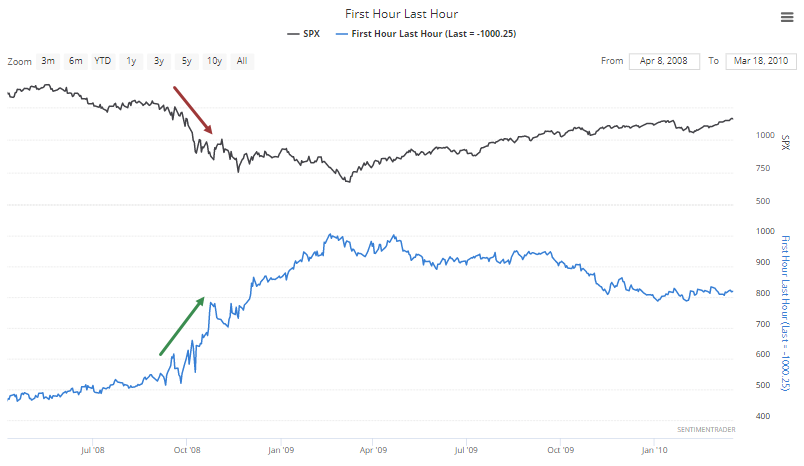
And during the worst of the October 2008 meltdown.
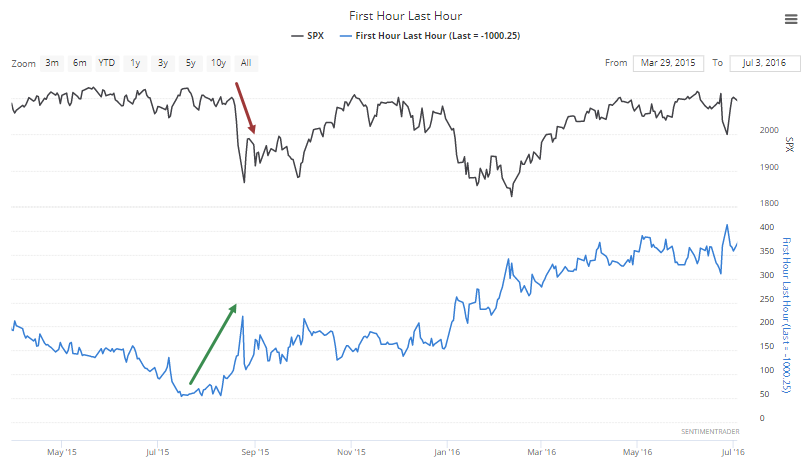
It happened again in August 2015.
And lastly, in May 2019, which didn't persist for long.
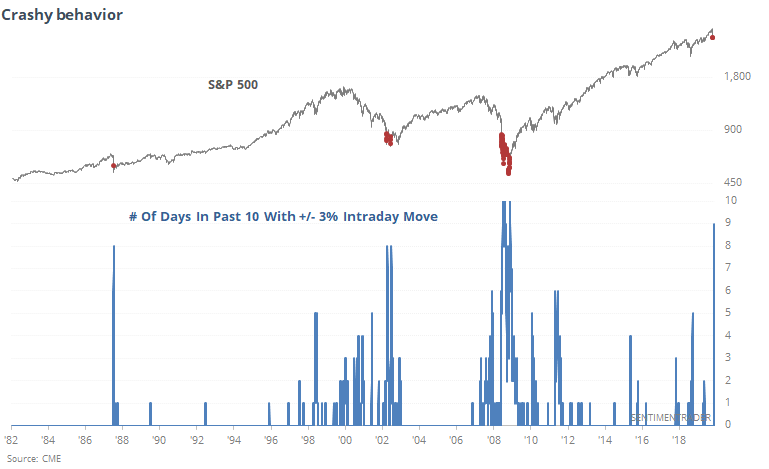
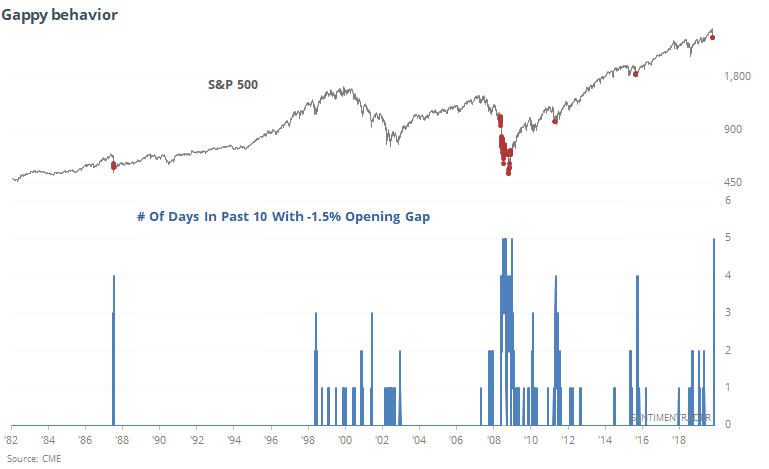
"Crashy" behavior
The swings that generated those moves in the FHLH indicator were helped along in large part by the overall volatility, which pushed the S&P futures more than 3% above or below the prior day's close in 9 out of the last 10 sessions. Only the crashiest of time periods come close to this.
Many of those days saw the day start quite a ways from where it closed the day before. And half of those were to the downside. Only 2008 saw this big of a cluster of large gaps down.
2. Breadth
Up volume nearing record low
Moves underlying the indexes over the past two weeks have been among the most volatile we've ever seen, which we've touched on several times in the past week.
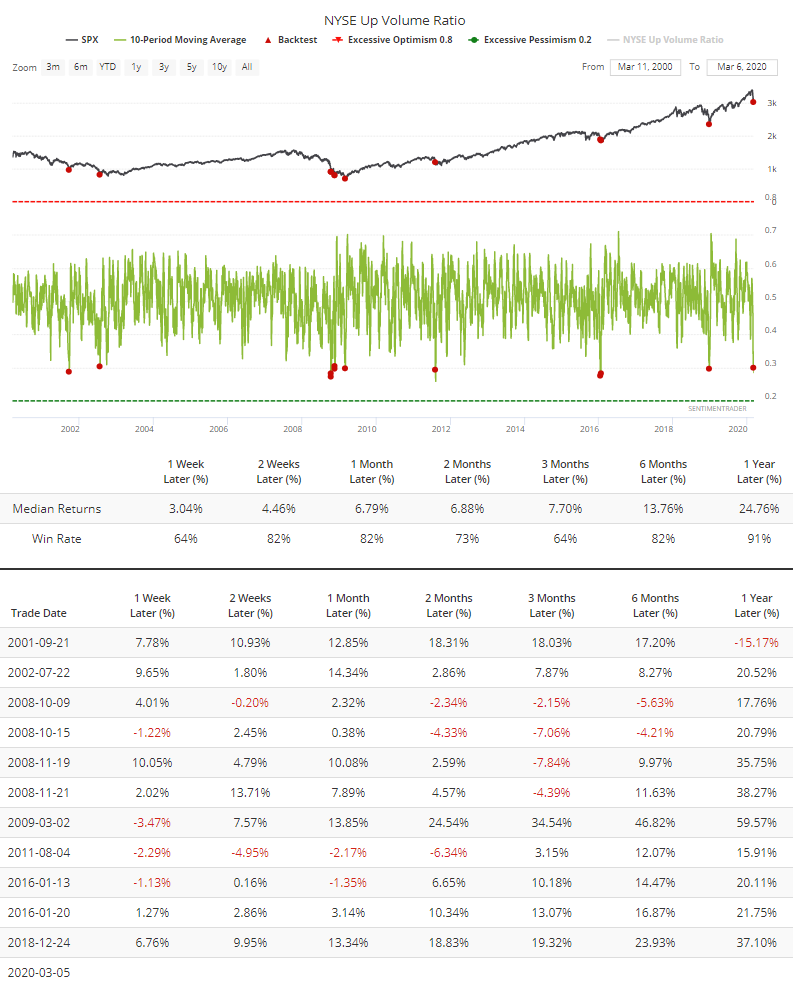
Most of that has been to the downside, enough so that the 10-day average of NYSE Up Volume has crossed below 30% for one of the few times in 60 years.
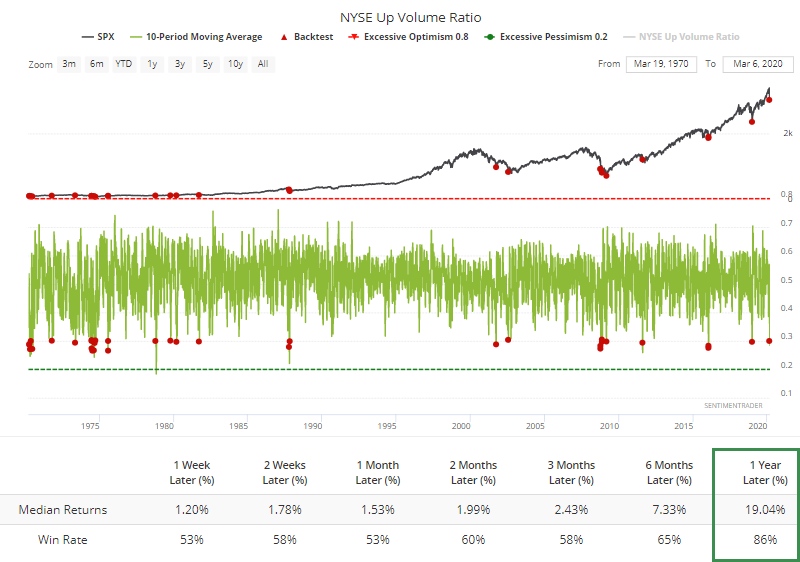
Returns weren't great over the next month, primarily because of persistently weak breadth in the 1960s, but long-term returns were very good.
When we use the Backtest Engine to check results over the last 20 years, there wasn't a whole lot of red in the table.
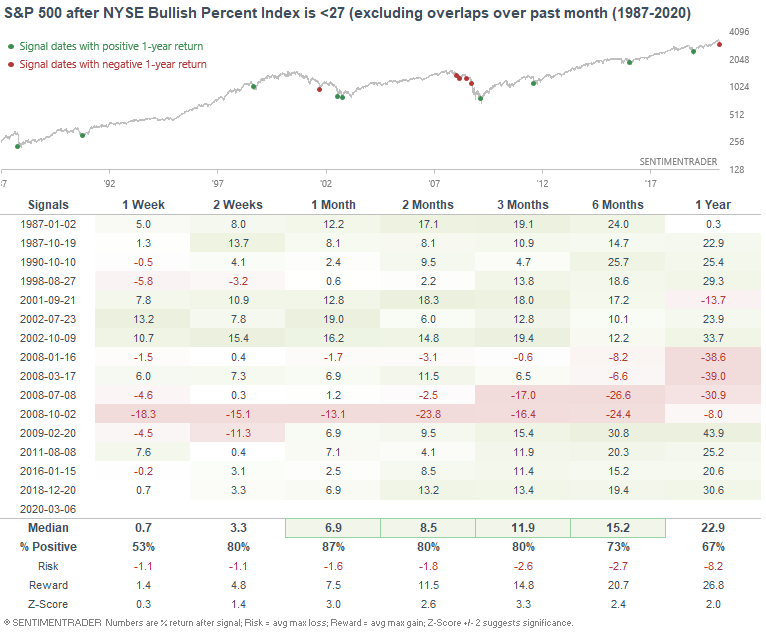
[TROY] Bullish Percent Index plunges
The NYSE Bullish Percent Index, a point and figure breadth indicator, has fallen below 27.
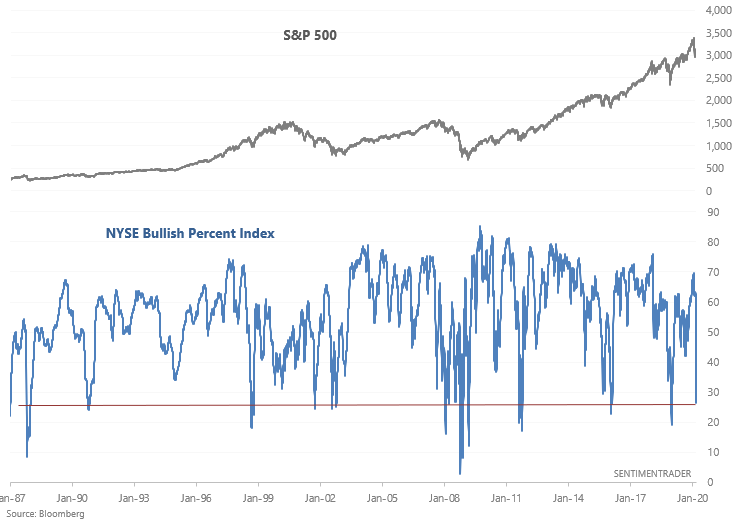
Historically, this was quite bullish for the S&P over the next 1-3 months. This even led to short term bounces during the start of the 2007-2009 bear market:
3. Sentiment
Options traders are starting to panic
Among the major equity index ETFs, options traders are paying record prices for puts relative to calls.
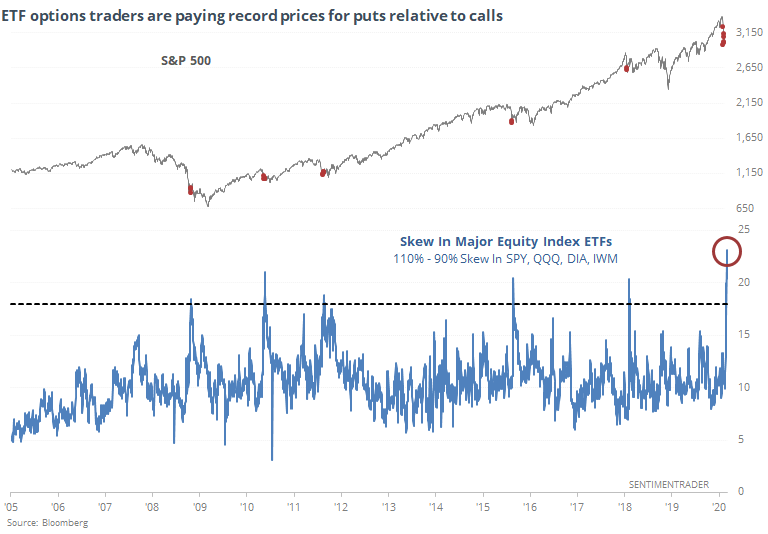
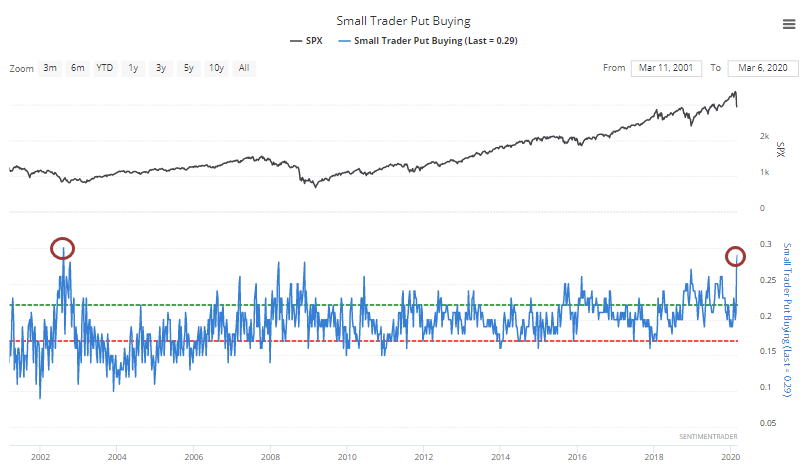
Some of this seems to be being driven by the smallest of options traders. This could be large traders who break up their orders into tiny lots, but more likely it's retail investors who react most emotionally to market moves.
Last week, they spent among the most they've ever spent of their total volume on buying protective put options to open. The only week that exceeded this was in August 2002.
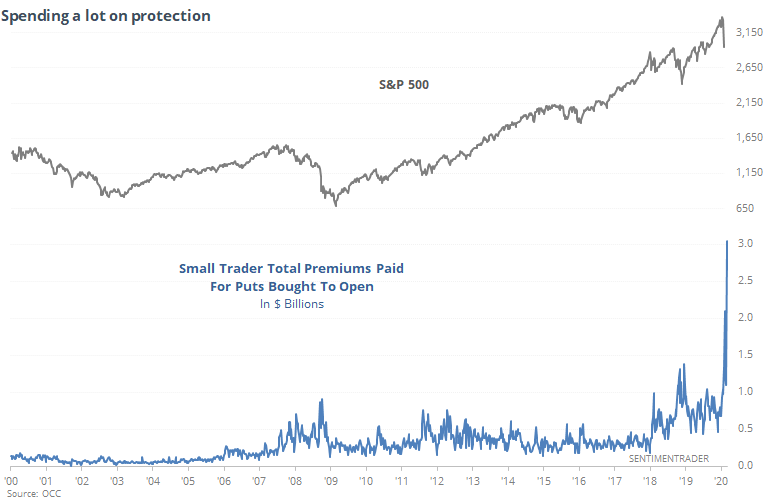
The most remarkable part about this? Last week, these traders spent more than $3 billion on those put options.
That is, by a very large amount, a record. They've been buying quite a few call options as well, though, so overall put/call ratios are high but not as extremes as we might think they should be.
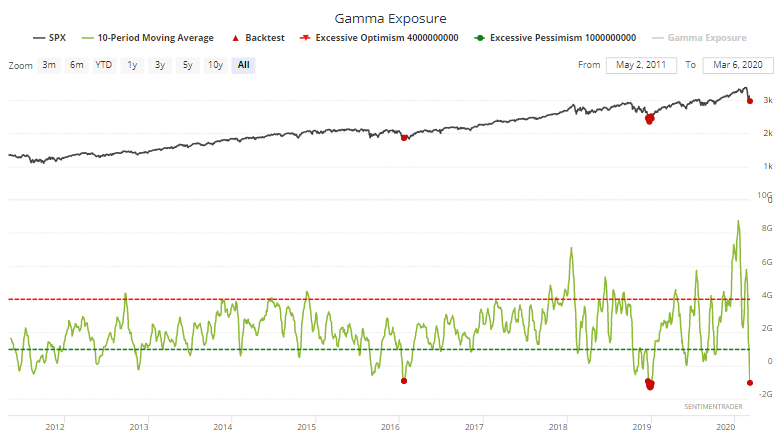
These wild swings in options trading has triggered massive swings in the gamma exposure that institutions have to the stock market. While this can be a self-fulfilling prophesy, when it starts to flip the other direction, the moves tend to be very large. The more extreme the Gamma Exposure is, the more likely we're going to see "spiky" moves in the other direction.
At the end of January, we saw that Wall Street was bullish on technicals much more than fundamentals. Analysts were raising price targets on stocks, but not earnings estimates.
They've changed tacks, and have now been busy lowering price targets while raising earnings estimates.
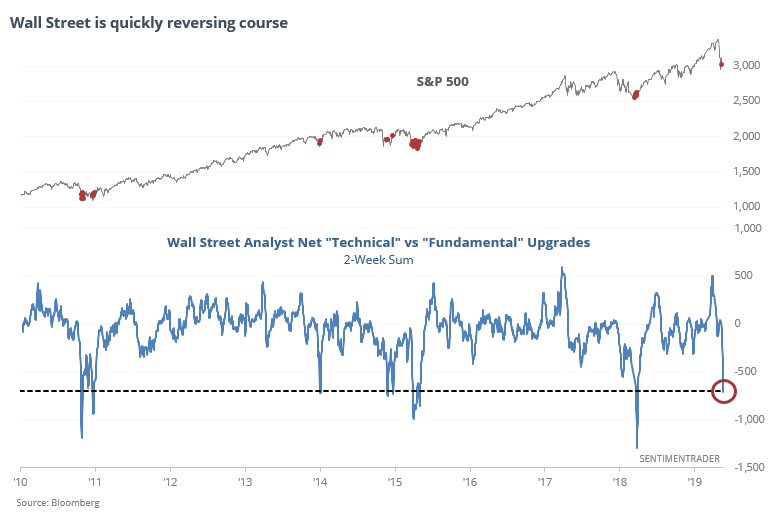
History is short here, but when Wall Street has become panicked on price but relatively sanguine on fundamentals, it has been a universally good sign for stocks.
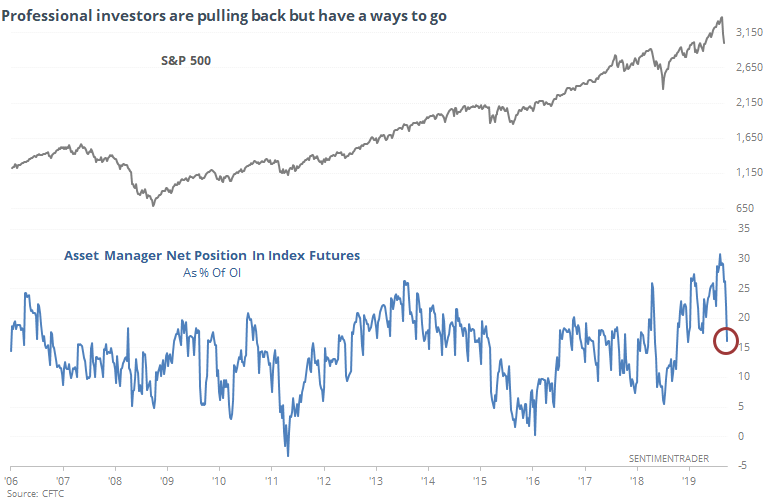
In the January 14 report, asset managers were carrying a record net long position in index futures. They've since cut their positions in half, but that's only put them about back to neutral. Better bottoms have come when these investors are closer to net short.
So, while not everything is showing pessimism, the extremes have been widespread enough to push the spread between Smart and Dumb Money to +50% for the first time in over a year.
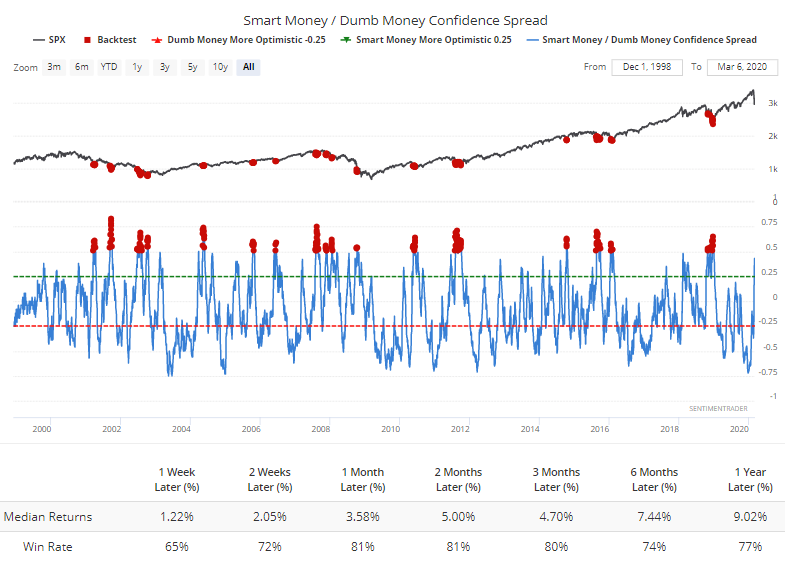
Returns were good over the next 1-3 months, but there were some early - and volatile - signals.
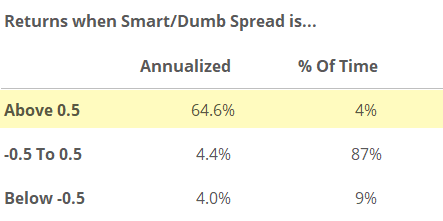
Overall, the S&P's annualized returns depending on where the spread is have been very good.
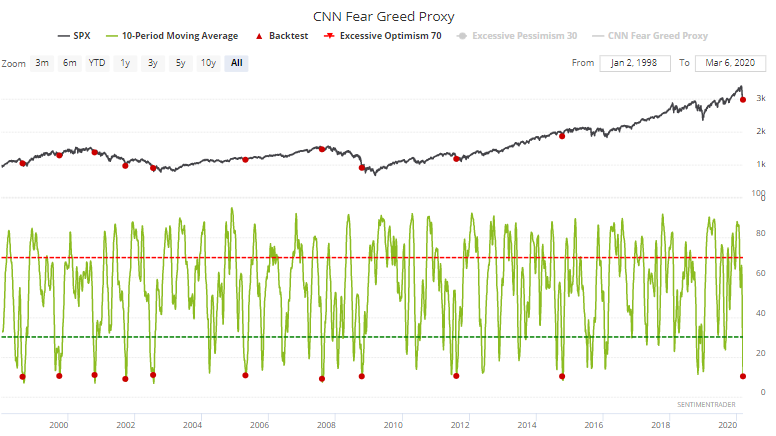
[TROY] Big Fear over the past two weeks
Investors and traders are still quite fearful, which is not surprising given the massive daily swings in equity markets. Our proxy for the popular CNN Fear & Greed Index's 10 day average has fallen below 11, a level which in the past, usually led to a S&P 500 rally over the next month:
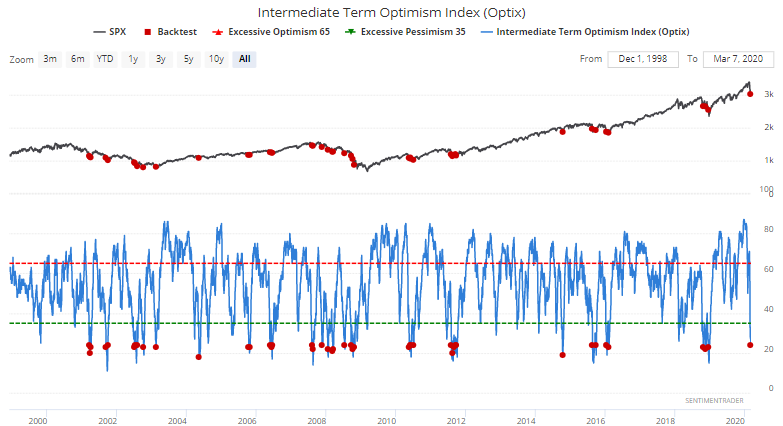
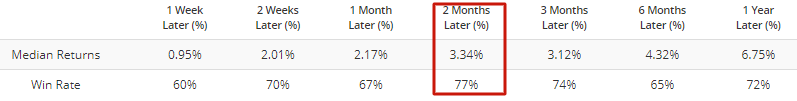
Similarly, the Intermediate Term Optimism Index has fallen below 24. Once again, 2 month forward returns for the S&P were more bullish than random:
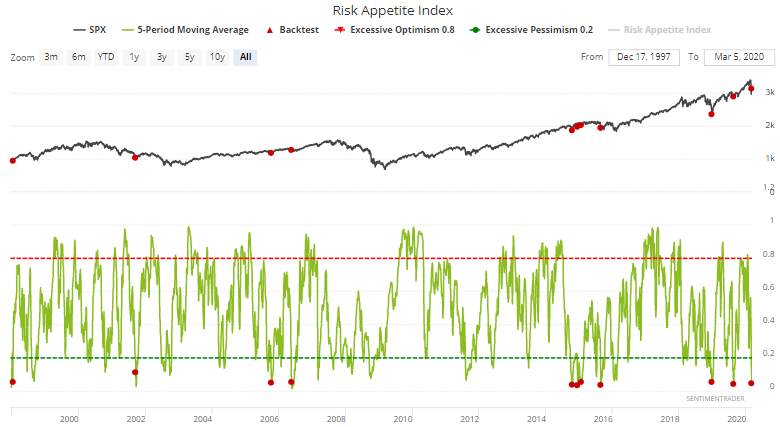
And lastly, the Risk Appetite Index's 5 day average is now below 0.05:
4. Sectors
[TROY] Financials plunge
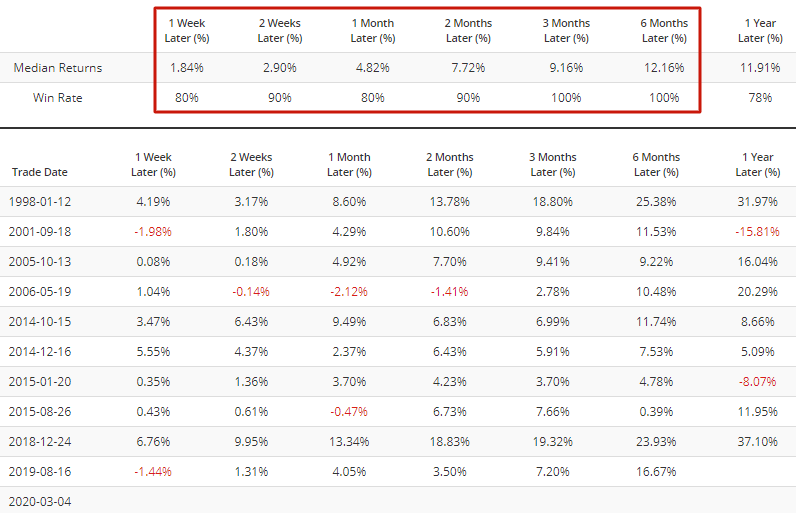
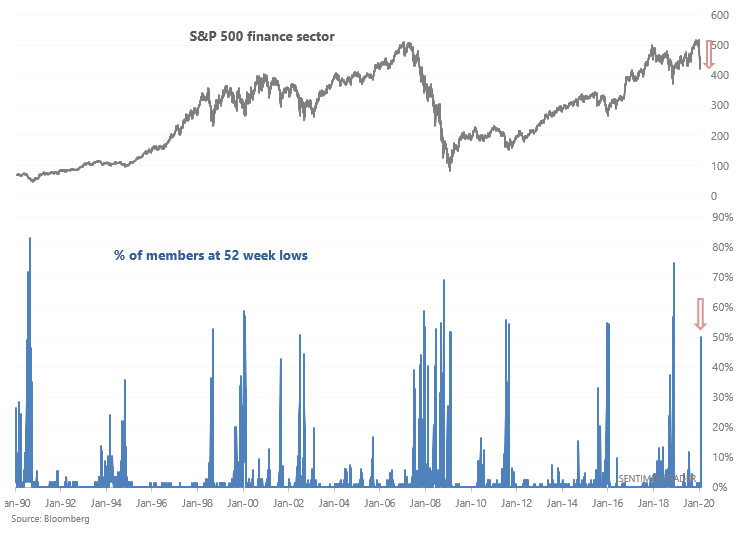
The financial sector has been hurt badly by the recent turmoil in equity markets and falling bond yields. 50% of the S&P 500 financial sector's members are now at 52 week lows:
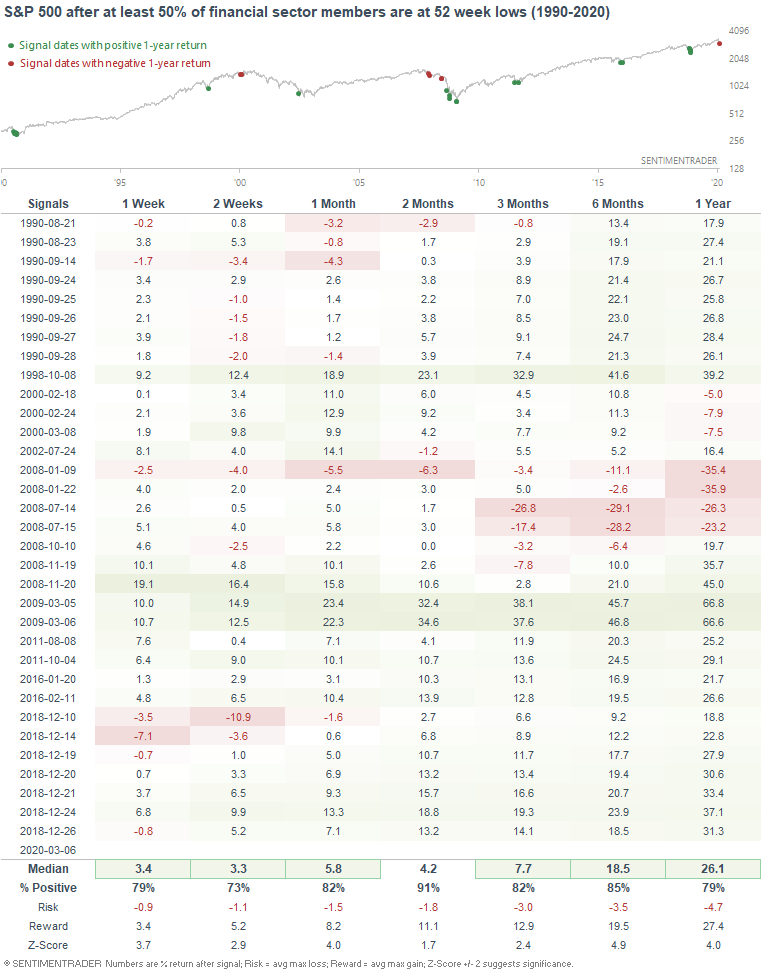
When this many financial sector members were at new lows in the past, the S&P 500's forward returns were more bullish than random on all time frames. This led to a short term rally even during the start of the 2007-2009 bear market:
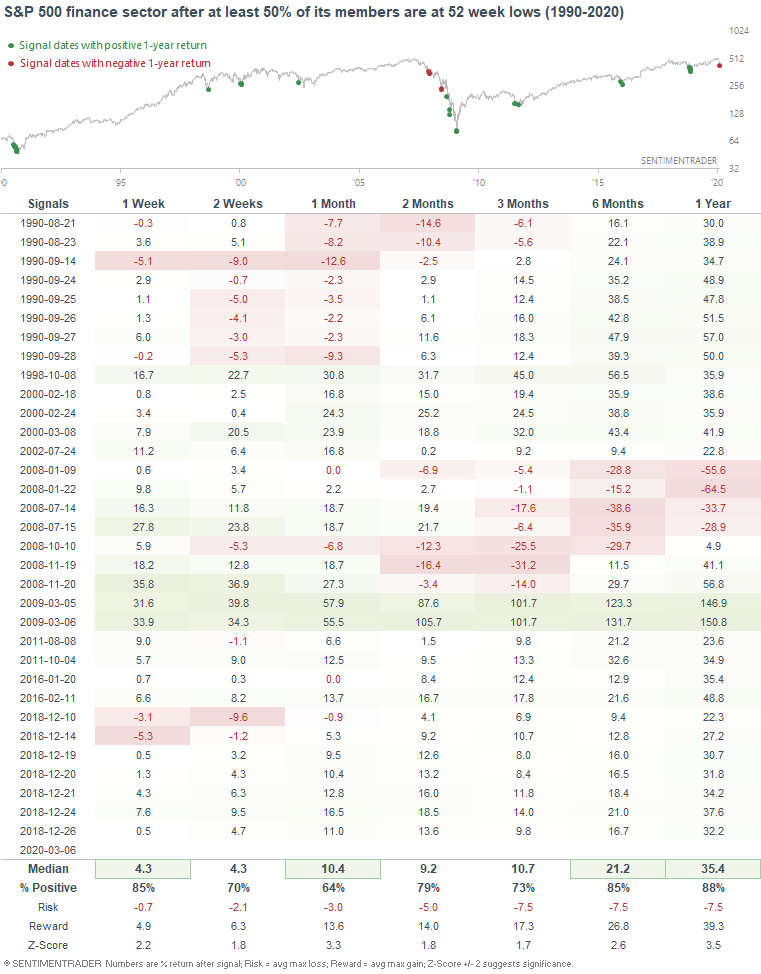
The S&P 500 financial sector's forward returns were less bullish due to the extreme financial sector crash of 2008:
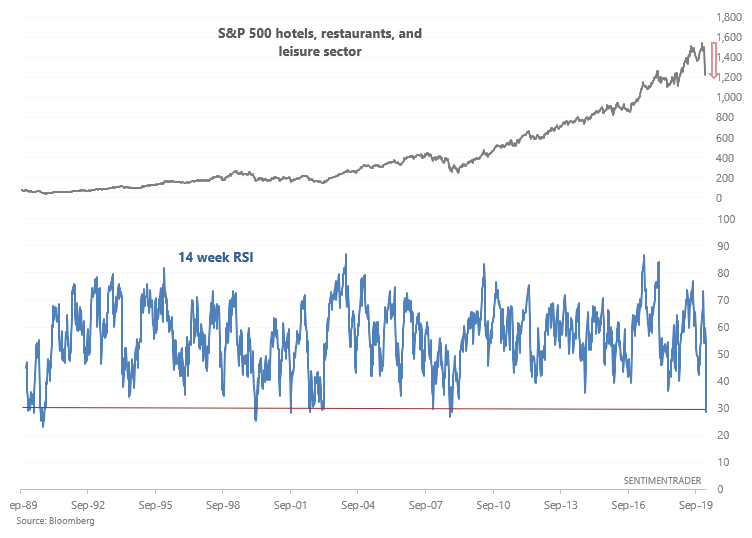
[TROY] Travel tanks
Aside from financials, anything related to travel & leisure has been hurt by coronavirus fears. Here's the S&P 500 hotels, restaurants, and leisure sector and its 14 week RSI.
*Also note the massive runup in travel/leisure over the past decade. This has clearly been a growth industry, no doubt helped by the rise of social media, travel vlogging, online video, etc. Some tourist destinations witnessed a 50x increase in visitors after a popular travel influencer mentioned the location. Similarly, Chinese tourism in Japan has increased 5x over the past few years (even though Japan is supposedly in a "lost decade"). There's opportunity everywhere - you just need to know where to look.
Historical cases were limited and included extreme events such as the October 2008 global financial meltdown, 9/11, and Gulf War. While this wasn't a clear short term bullish sign, it usually led to gains over the next year for the hotels, restaurants, and leisure sector.
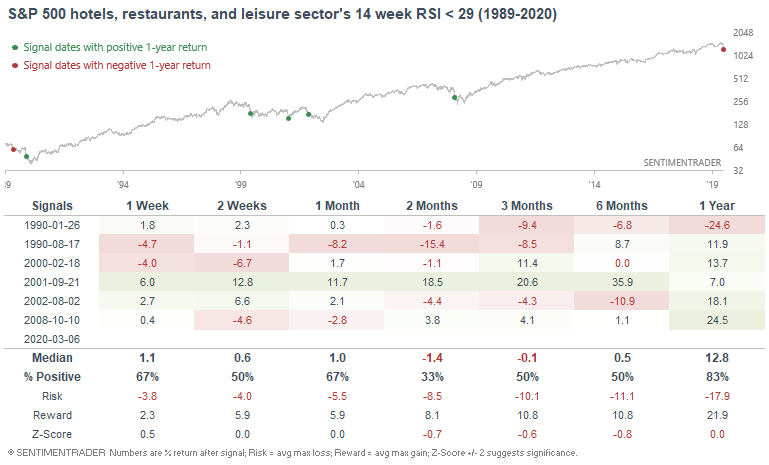
Speaking about skin in the game, if travel/leisure stocks continue to fall on mounting coronavirus fears, I will consider investing in this sector. Coronavirus is a temporary phenomenon (the world isn't ending), and the travel theme is not going to end anytime soon.
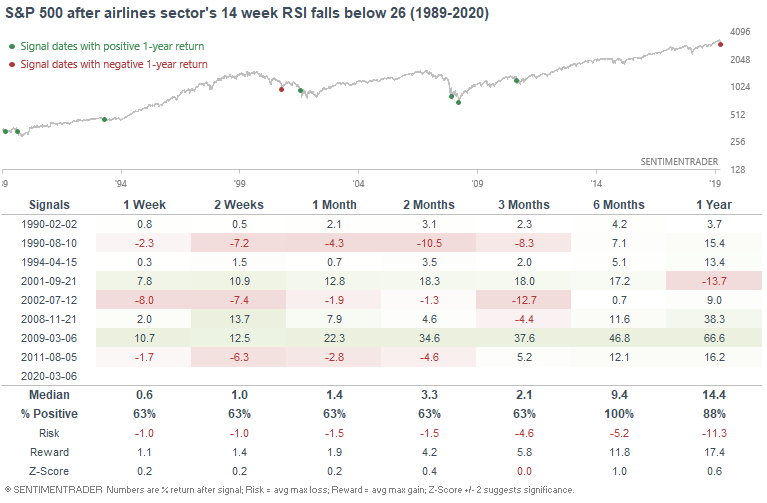
As you may also expect, airline stocks have crashed on recent coronavirus fears. Here's the S&P 500 airlines sector's 14 week RSI:
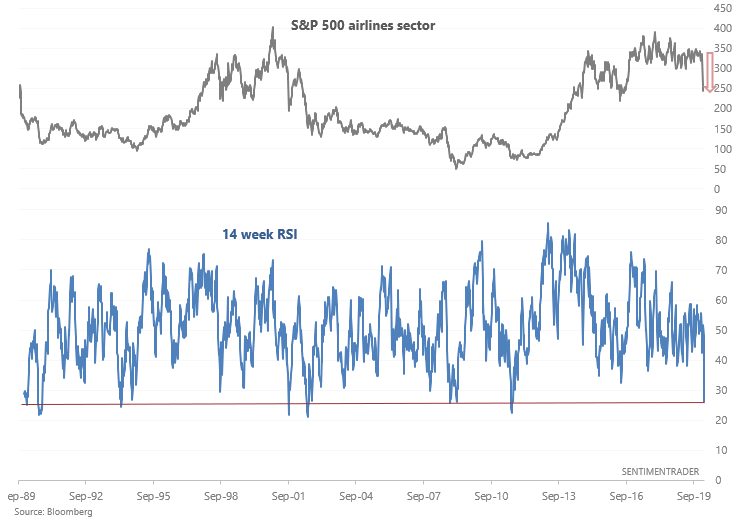
Such an epic crash in airline stocks wasn't a consistent contrarian factor - sometimes airline stocks fell even more before bottoming. There was a rally "eventually", although it's hard to tell if that rally began immediately or not.
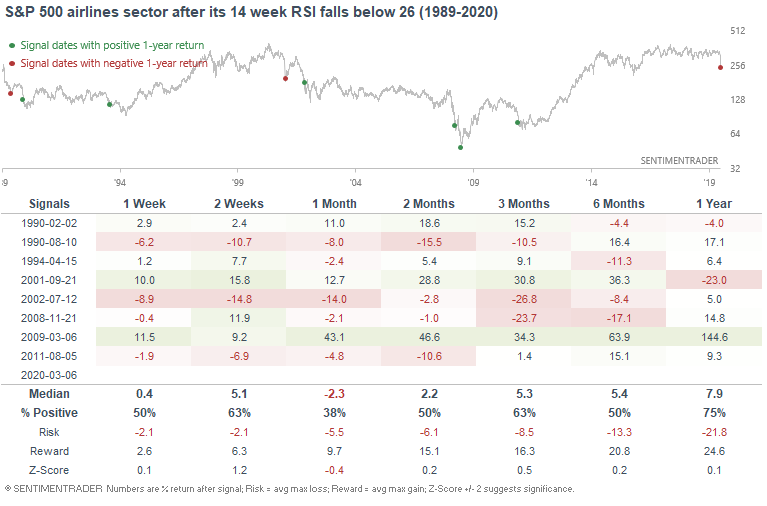
As for the S&P 500, this usually led to a rally over the next 6 months:
[TROY] Oil's slippery slope
It's not just equity markets that witnessed turmoil this week - oil crashed as well.
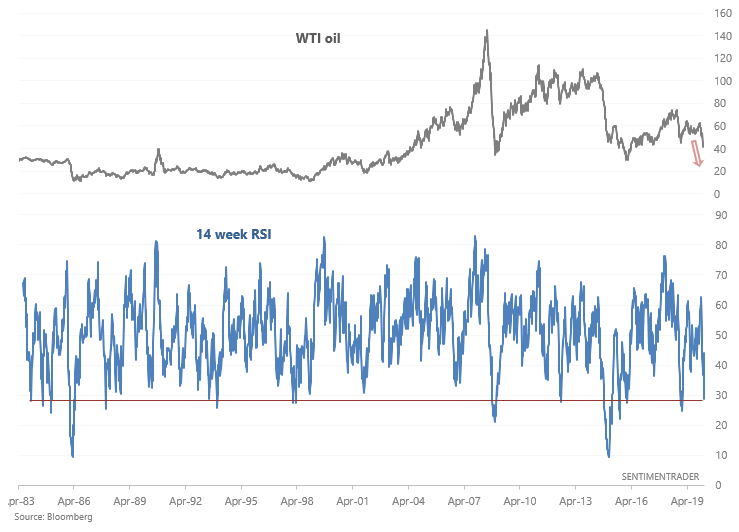
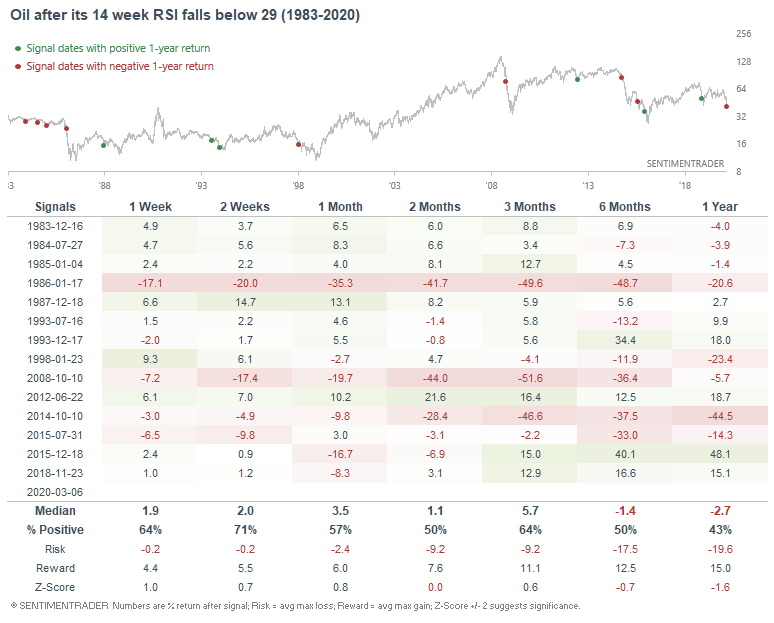
Oil's 14 week RSI is quite oversold. While it's tempting to see this as a positive factor for oil, that hasn't always been the case. "Eventually" there was a rally, but it's hard to know when. As traders, "when" is all that matters.
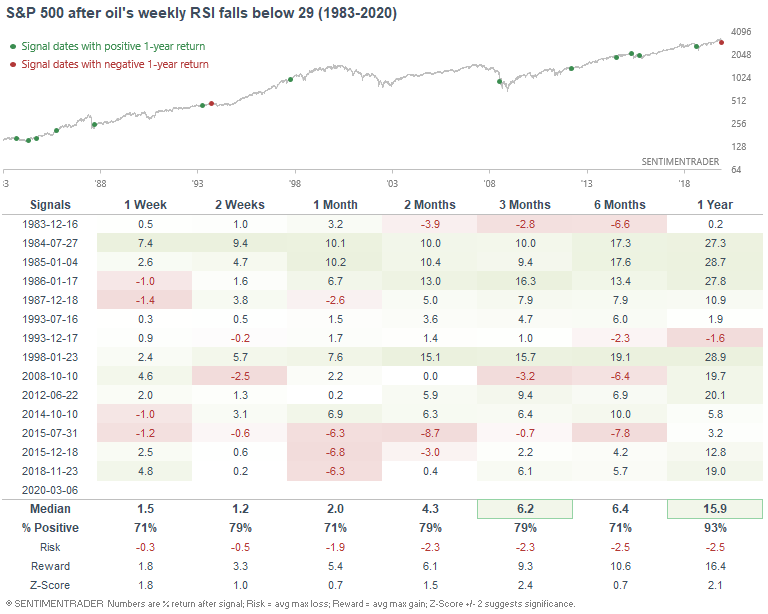
Meanwhile, turmoil in oil usually led to a rally in stocks over the next 3 months, since oil often crashes during periods of global economic fear:
More compressed crash
The weekly RSI has just entered oversold as Troy noted, thanks to its crash in a very short period of time. Over the past two weeks, front-month crude oil futures have lost more than 1% on 7 out of 10 sessions, culminating in Friday's 9% drop to new lows.
This is the kind of thing the contract has seen only 3 other times.
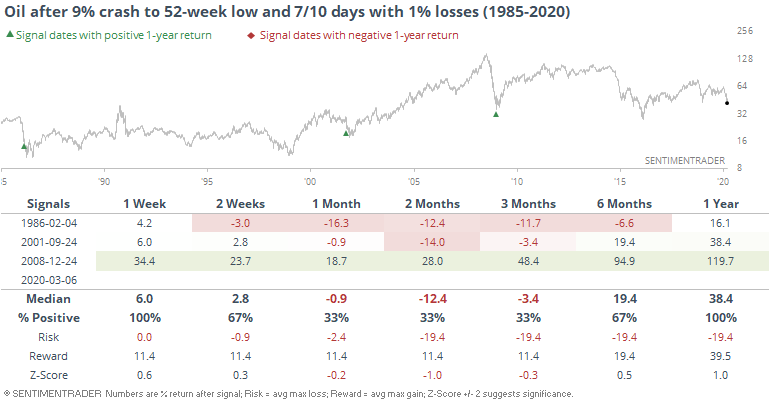
Twice, it fell more over the next two months, the final "puke" phases of those declines. All three times, it was solidly higher a year later.
These were mostly good dates for stocks, depending on the time frame.
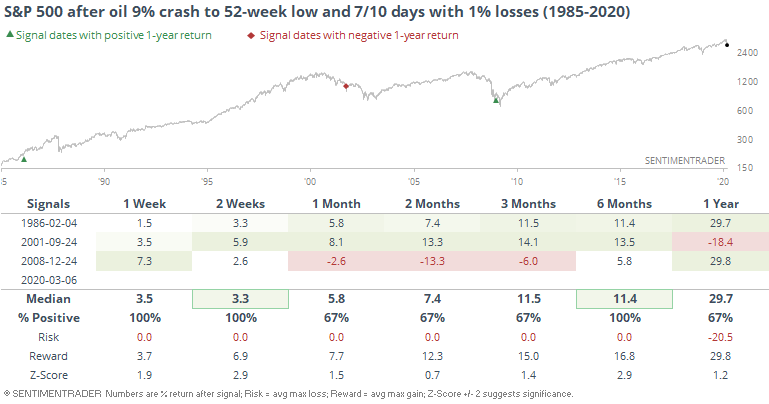
Stocks get hit, too
We already saw last week that there was such wholesale selling in energy stocks that it has only coincided with exhaustive selling in the past. That didn't mean there wasn't some short-term volatility, and we definitely got that this past week.
There isn't a perfect correlation between oil prices and energy stocks, but it's tight, and oil's plunge on Friday was not good to those shares. The S&P 500 energy sector fell more than 5% to a multi-year low.
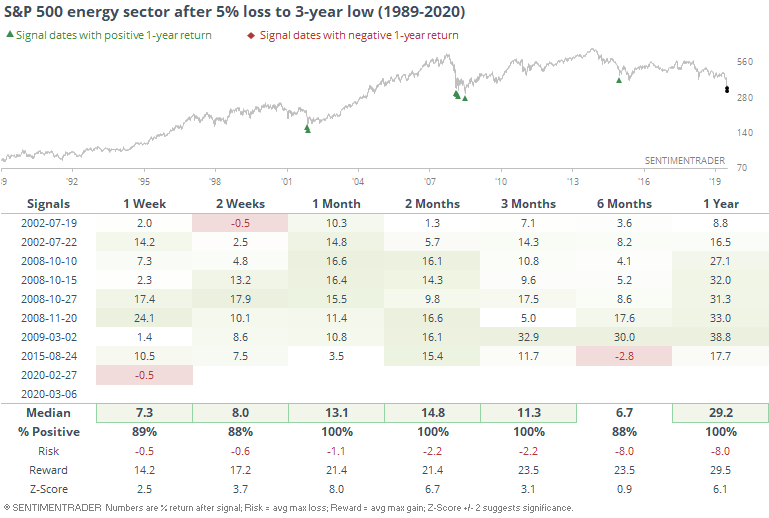
Each of the other times it got hit this hard, it bounced back over the next 1-3 months. This is the 2nd signal in a little over a week, which we also saw in July 2002 and October 2008.
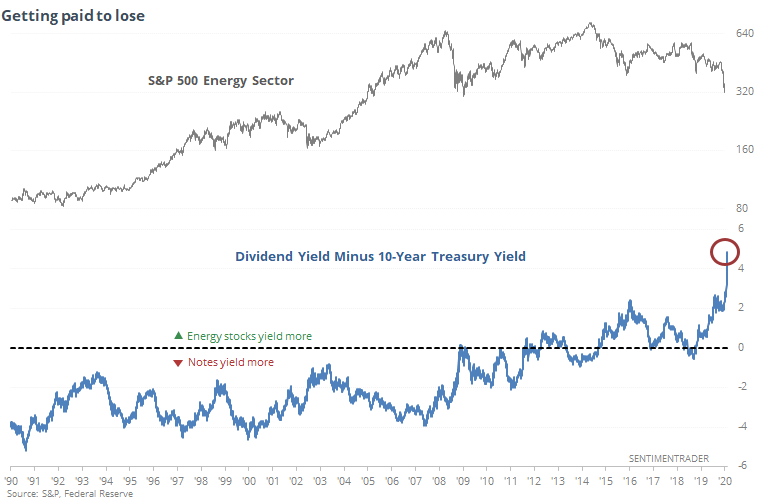
Because of the steep losses in the shares, and few dividend cuts (so far), combined with the plunge in Treasury yields, the energy sector's yield over notes has skyrocketed.
These are immensely uncomfortable times, mostly for the unfortunate souls who have contracted the virus or been directly impacted. Depending on one's priorities, losses in the markets are of secondary importance at best. There is always the chance that this is going to turn into a true Black Swan event, a grossly overused term. If so, then none of the above will matter by definition.
So, that's the bet here. Is this a once-in-a-decade kind of thing, or once-in-a-generation? The higher likelihood is the former, and even if it does end up morphing into a protracted bear market, the kinds of readings we're seeing now have consistently preceded multi-month relief rallies before the decline resumes in earnest.