Products
SentimenTrader Trading Tools
‍
Backtest Engine
My Trading Toolkit
Correlation Analysis
Seasonality
Indicators & Data API
‍
Proprietary Indicators & Charts
Market Data API
Strategies & Scanner
‍
50+ Trading Strategies
Smart Stock Scanner
Research Reports
‍
Research Solutions
Reports Library
Free Resources
Simple Backtest Calculator
Simple Seasonality Calculator
The Kelly Criterion Calculator
Sentiment Geo Map
Public Research Reports
Pricing
Company
About
In the News
Testimonials
Client Success Stories
Contact
Log inLoginSign up
< BACK TO ALL REPORTS

Average True Range Reversal Buy Signal Concept - Part 2

Dean Christians
2021-08-06
In my note on Thursday, 8/5/21, I shared a trading signal that uses the Average True Range indicator. Let's review the ATR spread signal performance results for several actively traded ETFs.

In my note on Thursday, 8/5/21, I shared a trading signal that uses a derivative of the average true range indicator from J. Welles Wilder. For more details on the concept, please click here.

Because the ATR spread signal thrives on volatility, we want to ensure that we trade ETFs that provide opportunities. i.e., an ETF like Consumer Staples (XLP) is not on my radar.

Today's note aims to share additional information for some of the most actively traded ETFs I follow.

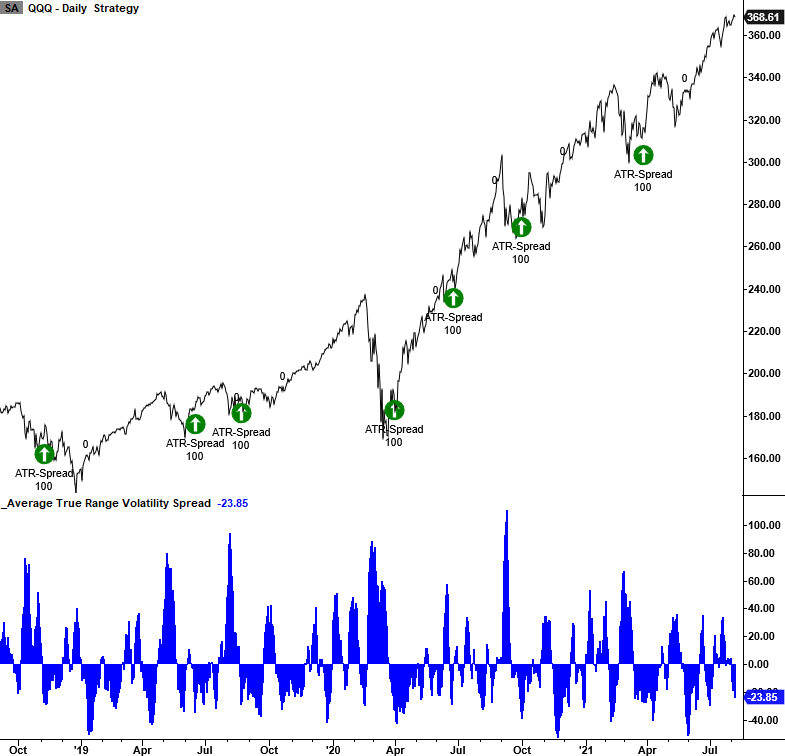
CURRENT DAY CHART - NASDAQ 100 ETF (QQQ)

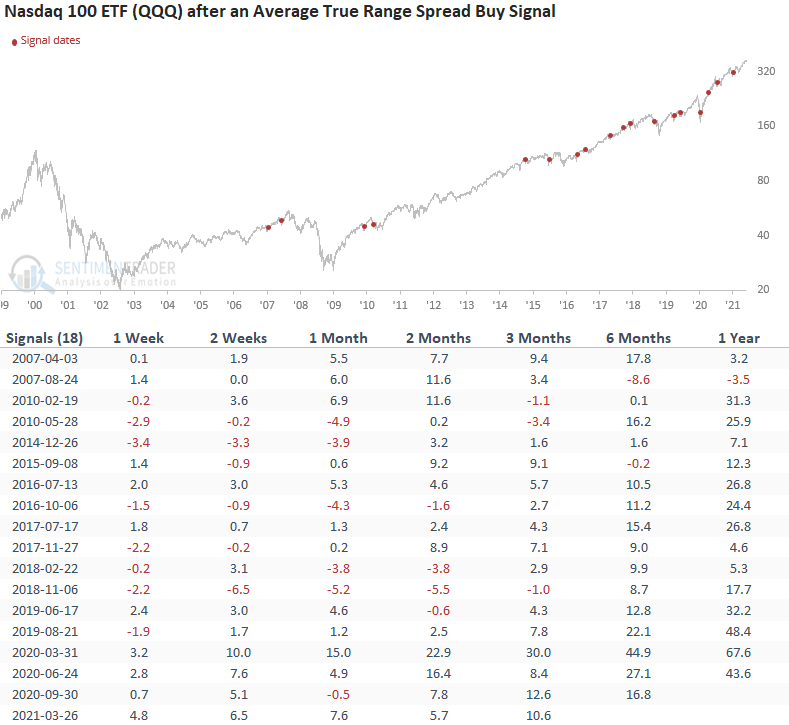
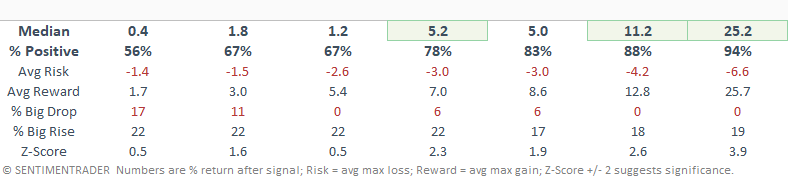
HOW THE SIGNALS PERFORMED - NASDAQ 100 ETF (QQQ)

In case you were wondering, I included the optimal spread brackets in the statistics table. So, for a QQQ signal to occur, the ATR spread must first cross above 55%. Once that condition is confirmed, the ATR spread must then cross below -25.5%. The brackets are labeled reset and buy level, and you will find them in each table.

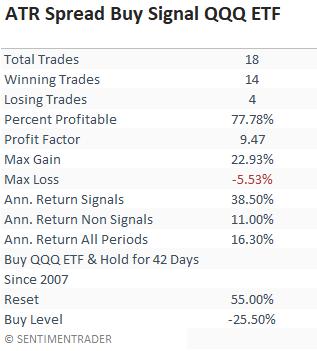
The intermediate to long-term performance looks good, and the model did an excellent job of avoiding trouble in the 2000-02 bear market. The days since a reset to buy level count and rate of change conditions are critical factors in reducing unfavorable signals in bear markets.

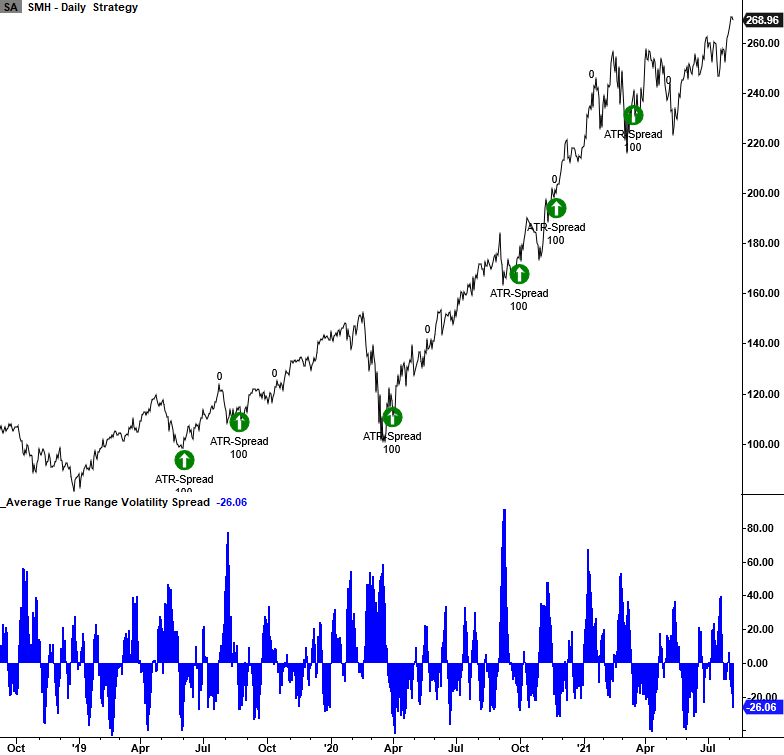
CURRENT DAY CHART - SEMICONDUCTOR ETF (SMH)

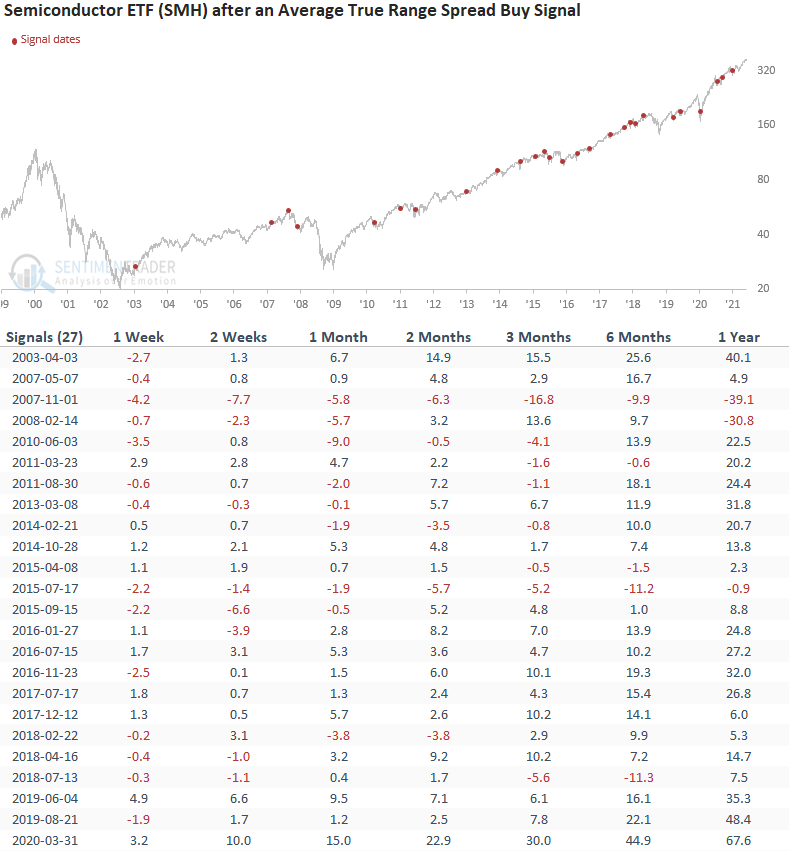
HOW THE SIGNALS PERFORMED - SEMICONDUCTOR ETF (SMH)

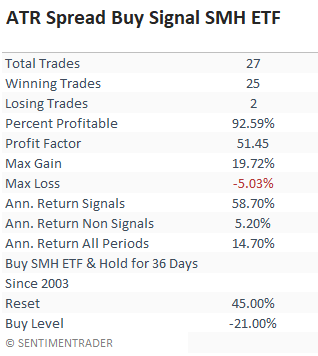
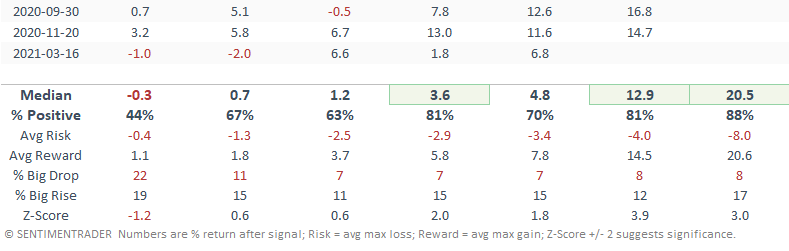
Besides the 1-week timeframe, performance looks good, especially in the 2-12 month window.

CURRENT DAY CHART - RUSSELL 2000 ETF (IWM)


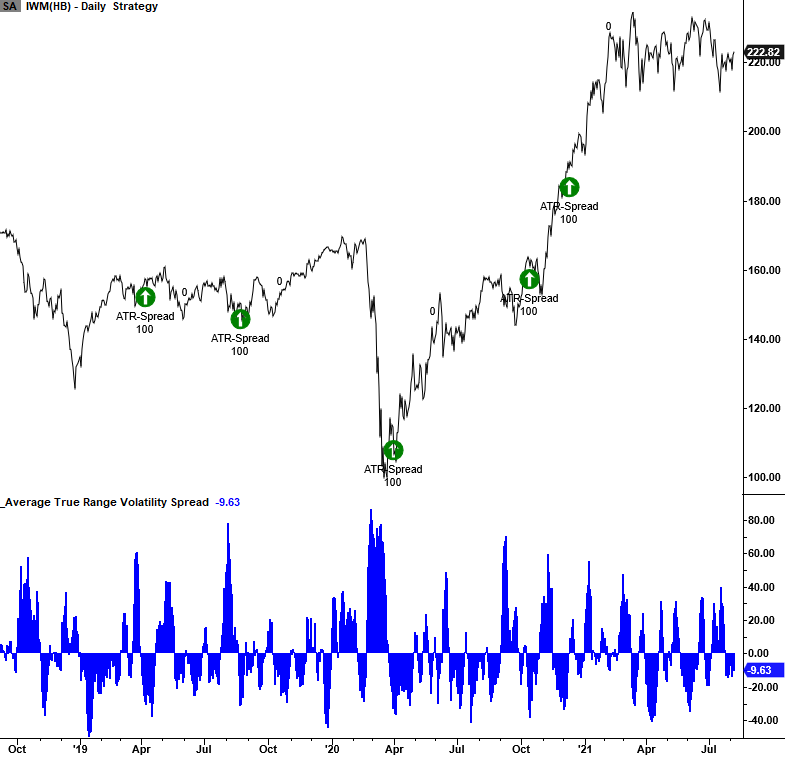
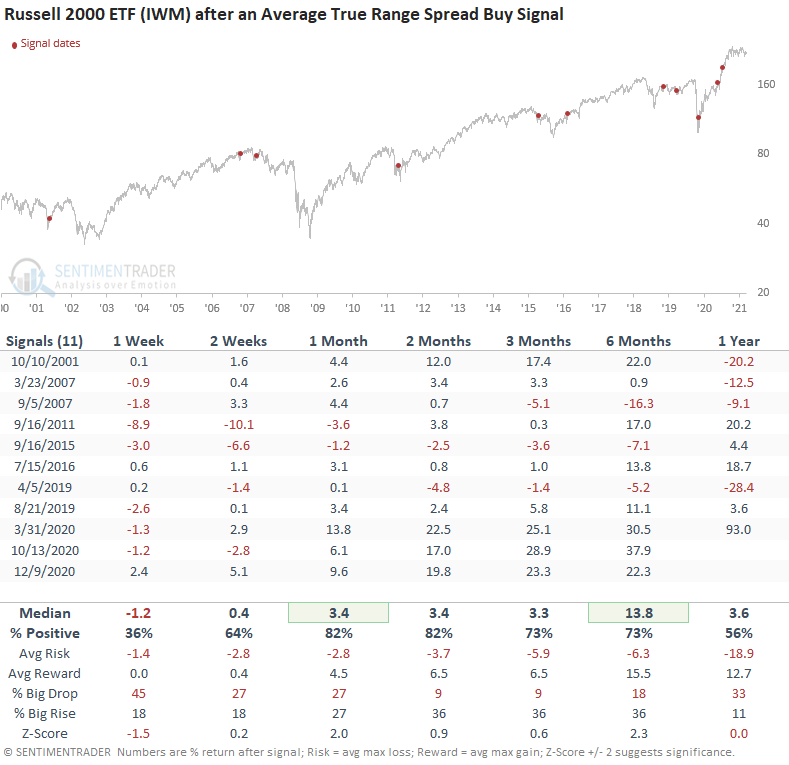
HOW THE SIGNALS PERFORMED - RUSSELL 2000 ETF (IWM)

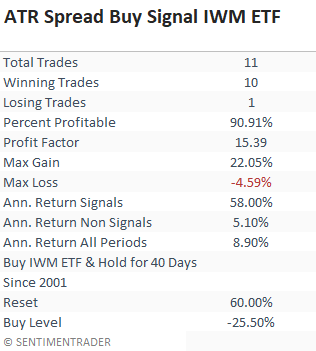
Besides the 1-week timeframe, performance looks good, especially in the 1-6 month window.

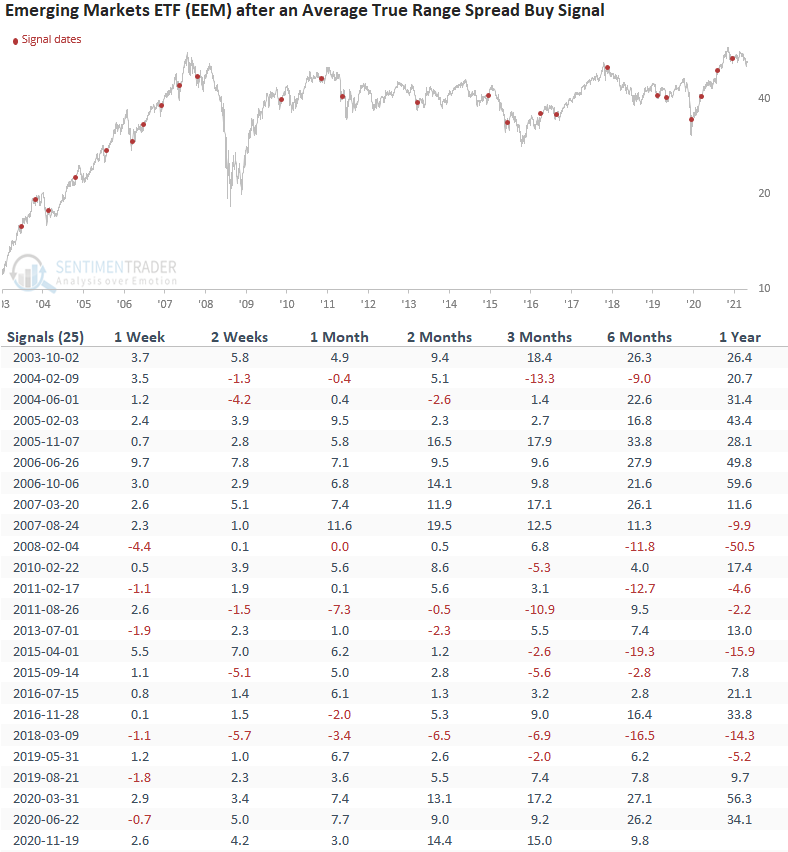
CURRENT DAY CHART - EMERGING MARKETS ETF (EEM)

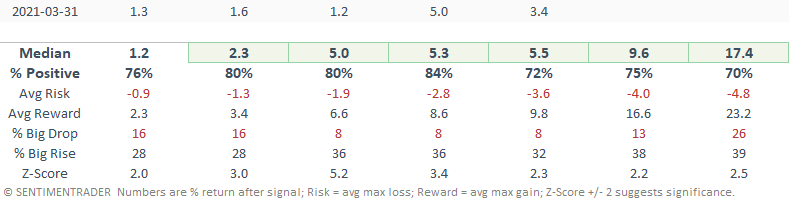
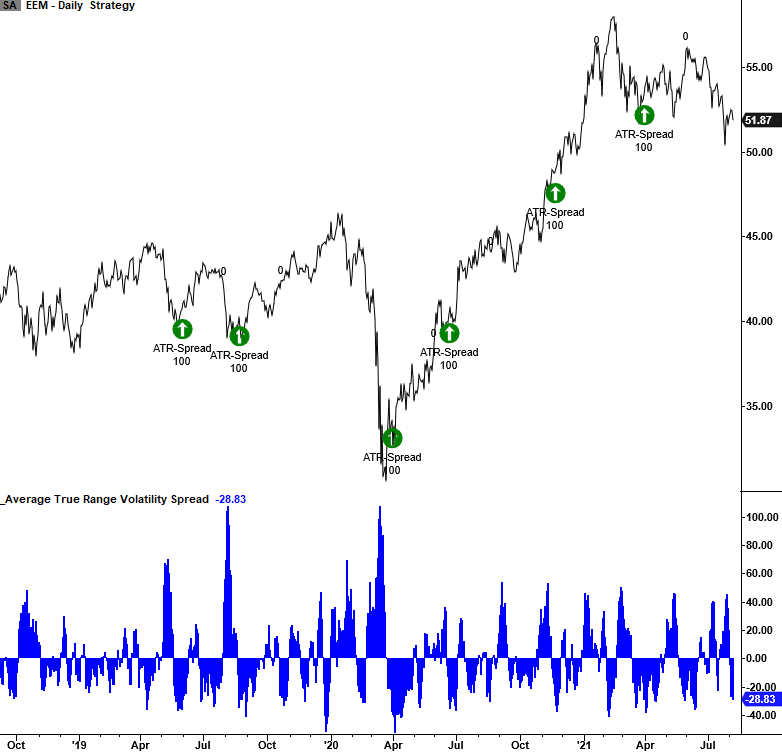
HOW THE SIGNALS PERFORMED - EMERGING MARKETS ETF (EEM)

The EEM ETF has a higher hurdle rate for the 5-day rate of change condition. It uses a threshold level of 2%, whereas most other ETFs only require a rate of change greater than zero.

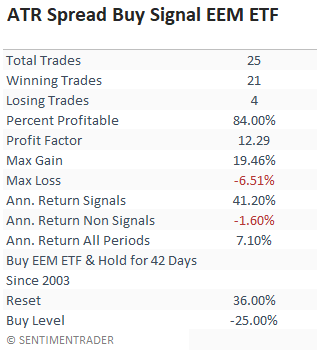
The emerging markets ETF performance results look fantastic, with a solid risk/reward profile in 6/7 timeframes.

As I stated in my note on Thursday, the threshold levels for a signal may vary depending on the asset class. One can also adjust the levels to either increase or decrease the number of instances. i.e., if we wanted fewer signals that represented a more profoundly oversold market condition, one could raise the reset level from, say, 50% to 75%.

Sorry, you don't have access to this report

Upgrade your subscription plan to get access
Go to Dasboard
PRODUCTS
SentimenTrader
Trading Tools
Indicators & Data API
‍
Strategies & Scanner
‍
Research Reports
FREE
RESOUrCES
Simple Backtest
Calculator
Simple Seasonality
Calculator
The Kelly Criterion
Calculator
Sentiment Geo Map
‍
Public Research Reports
‍
Pricing
Bundle pricing
‍
Announcements
‍
FAQ
COMPANY
‍
About
‍
In the News
‍
Testimonials
‍
Client Success Stories
CONTACT
‍
General Inquiries
‍
Media Inquiries
‍
Financial Professionals Inquiries
‍
© 2025 Sundial Capital Research Inc. All rights reserved.
Setsail Marketing
TermsPrivacyAffiliate Program
Risk Disclosure: Futures and forex trading contains substantial risk and is not for every investor. An investor could potentially lose all or more than the initial investment. Risk capital is money that can be lost without jeopardizing ones’ financial security or life style. Only risk capital should be used for trading and only those with sufficient risk capital should consider trading. Past performance is not necessarily indicative of future results.

Hypothetical Performance Disclosure: Hypothetical performance results have many inherent limitations, some of which are described below. No representation is being made that any account will or is likely to achieve profits or losses similar to those shown; in fact, there are frequently sharp differences between hypothetical performance results and the actual results subsequently achieved by any particular trading program. One of the limitations of hypothetical performance results is that they are generally prepared with the benefit of hindsight. In addition, hypothetical trading does not involve financial risk, and no hypothetical trading record can completely account for the impact of financial risk of actual trading. for example, the ability to withstand losses or to adhere to a particular trading program in spite of trading losses are material points which can also adversely affect actual trading results. There are numerous other factors related to the markets in general or to the implementation of any specific trading program which cannot be fully accounted for in the preparation of hypothetical performance results and all which can adversely affect trading results.

Testimonial Disclosure: Testimonials appearing on this website may not be representative of other clients or customers and is not a guarantee of future performance or success.